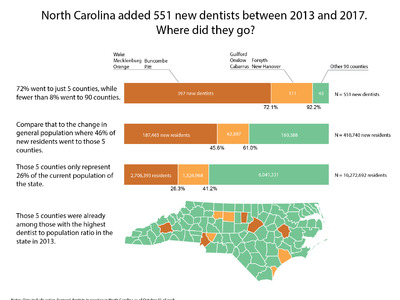
How does the racial and ethnic diversity of NC health professionals compare to the racial and ethnic diversity of the state population?
Trends in the Racial and Ethnic Diversity of Health Professions (2022)
By Brianna Lombardi, Haley Simons, Connor Sullivan, Evan Galloway, Erin Fraher
Mar 27, 2024
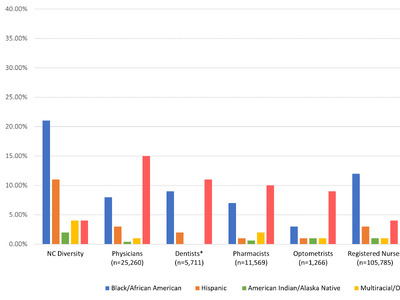
In this data brief, we used North Carolina state licensure data from the Health Professions Data System (HPDS) to explore the racial/ethnic diversity of selected health professions (physicians, dentists, pharmacists, optometrists, registered nurses [RNs], licensed practical nurses [LPNs], physical therapists [PTs], occupational therapists [OTs]) in North Carolina. We examined how the racial/ethnic diversity of each licensed profession in 2022 compares to the state population in 2022.1 Findings are presented in Figure 1.
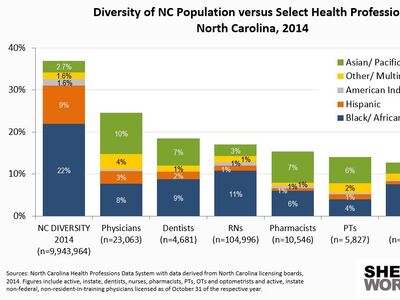
Figure 1. Racial/Ethnic Diversity of NC Health Professions vs. NC Population Diversity, 2022
Source: Population census data and estimates are downloaded from the North Carolina Office of State Budget and Management County/State Population Projections: Hispanic Origin by Race (2010-2050) and Sex, Race, Age Groups (2000-2050). Professions data are produced by the North Carolina Health Professions Data System with data derived from North Carolina licensing boards, 2022. Figures include licensed, active, instate non-federal, non-resident-in-training physicians, dentists, pharmacists, optometrists, registered nurses, licenses practical nurses, physical therapists, and occupational therapists as of October 31, 2022. These data examine the practitioners who reported race/ethnicity data to their respective North Carolina state board. * The North Carolina State Board of Dental Examiners does not collect data on the American Indian/Alaska Native racial/ethnic category.
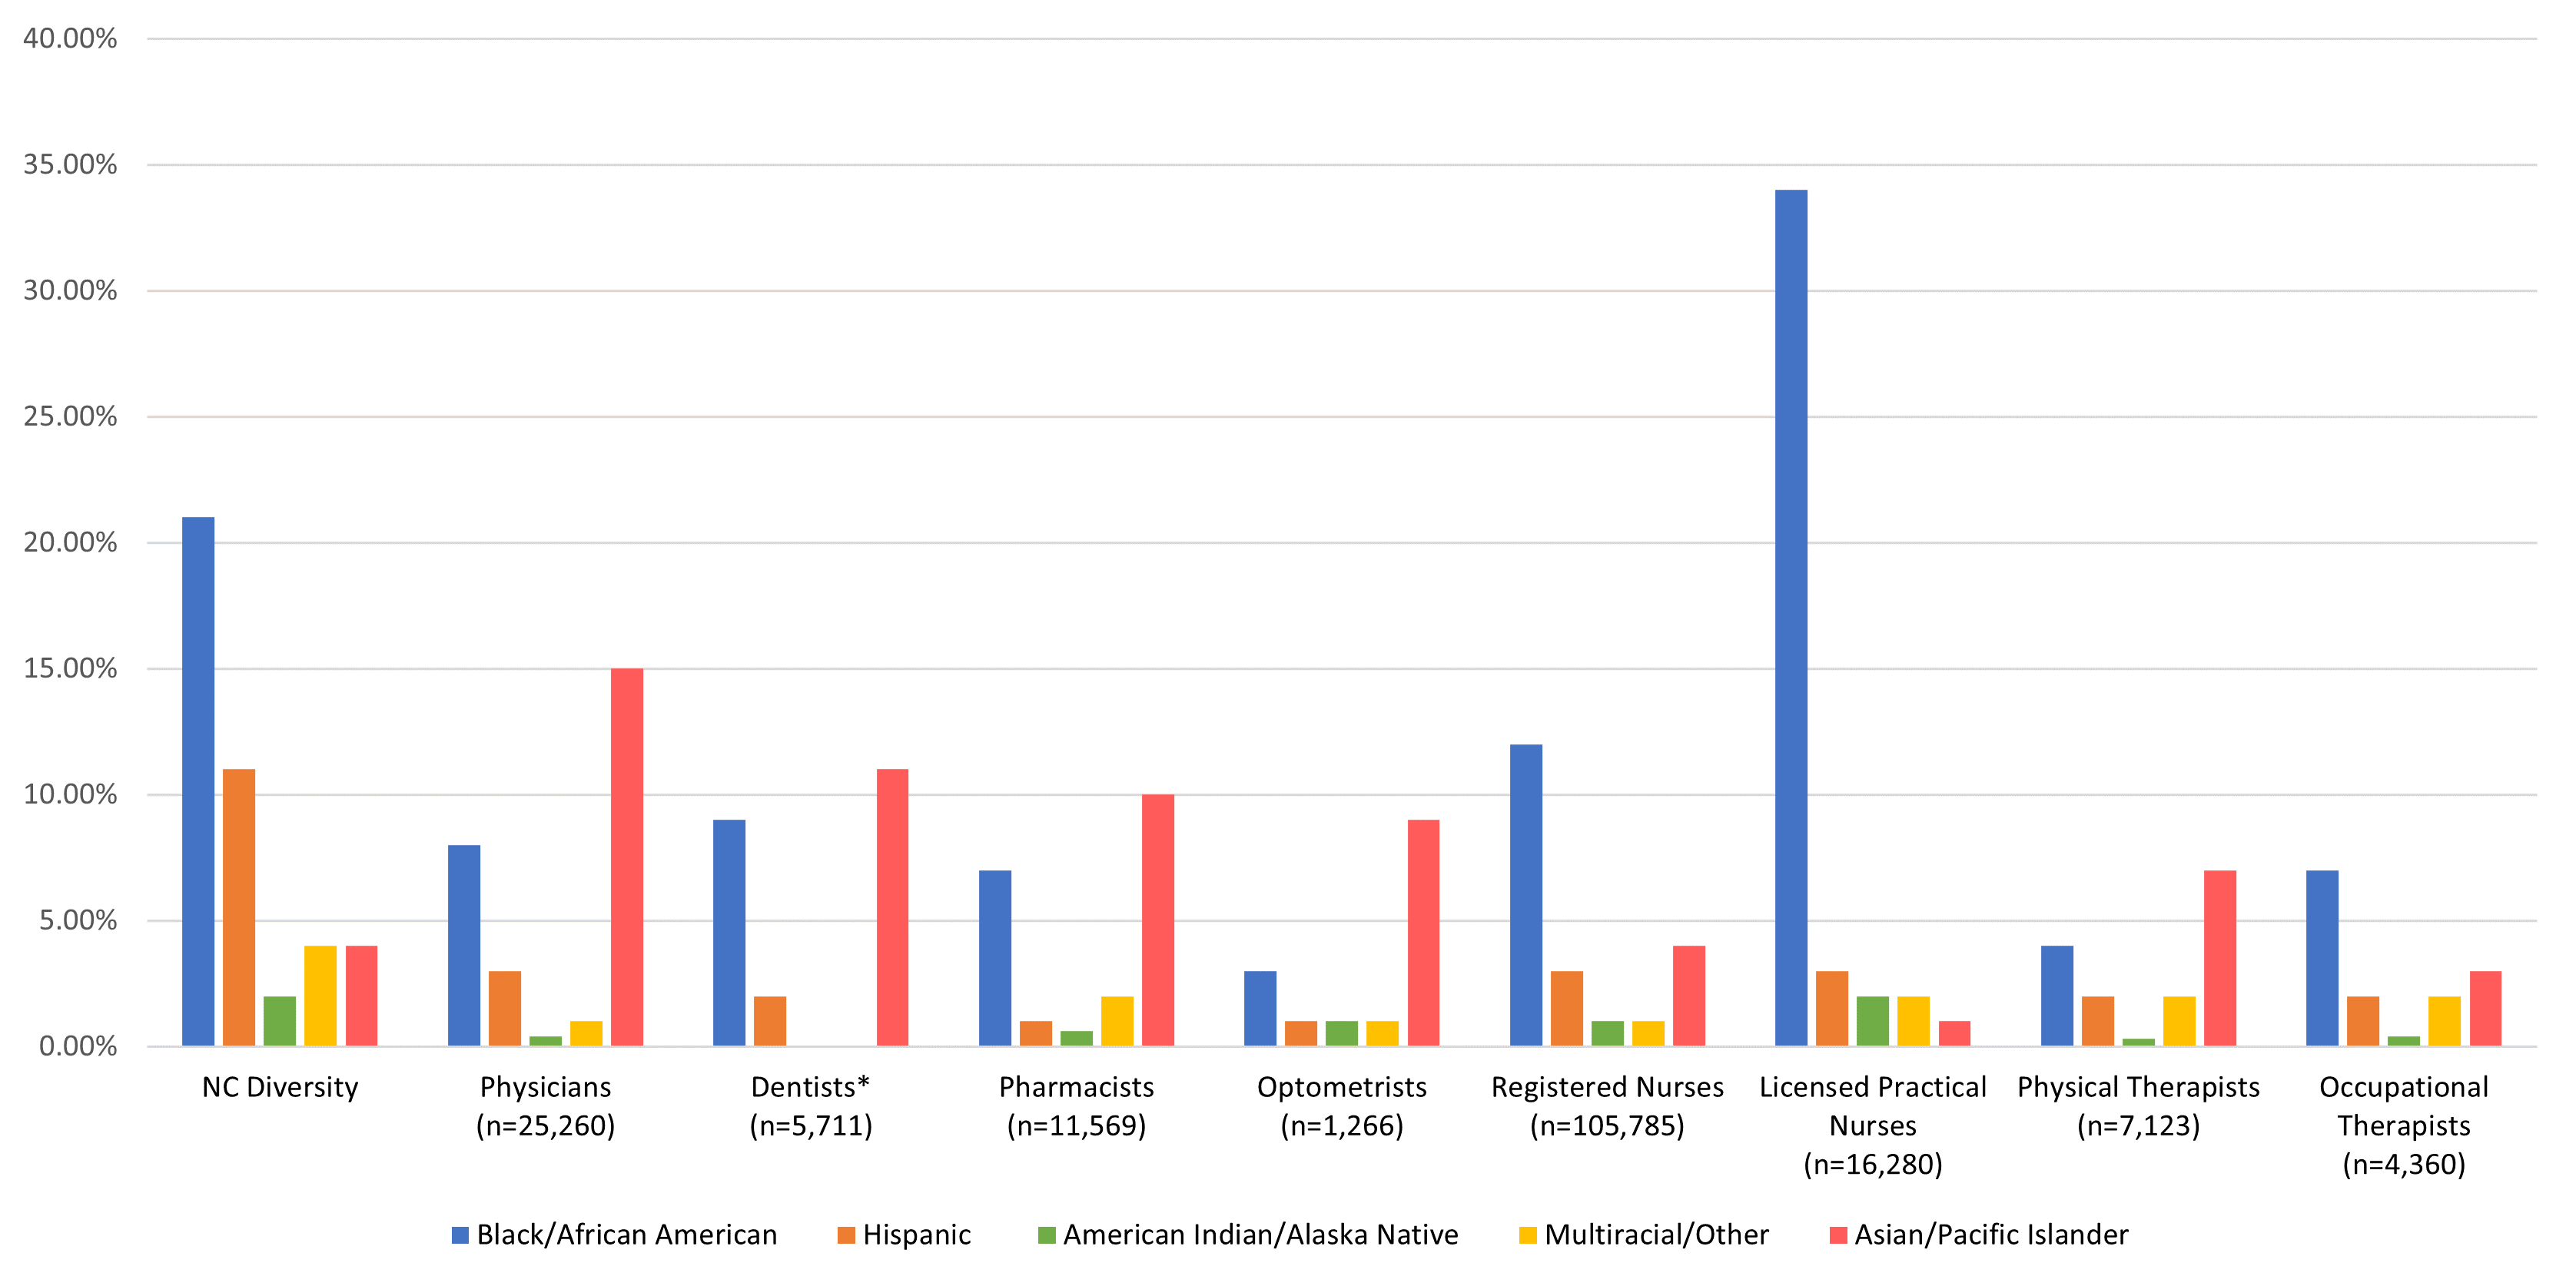
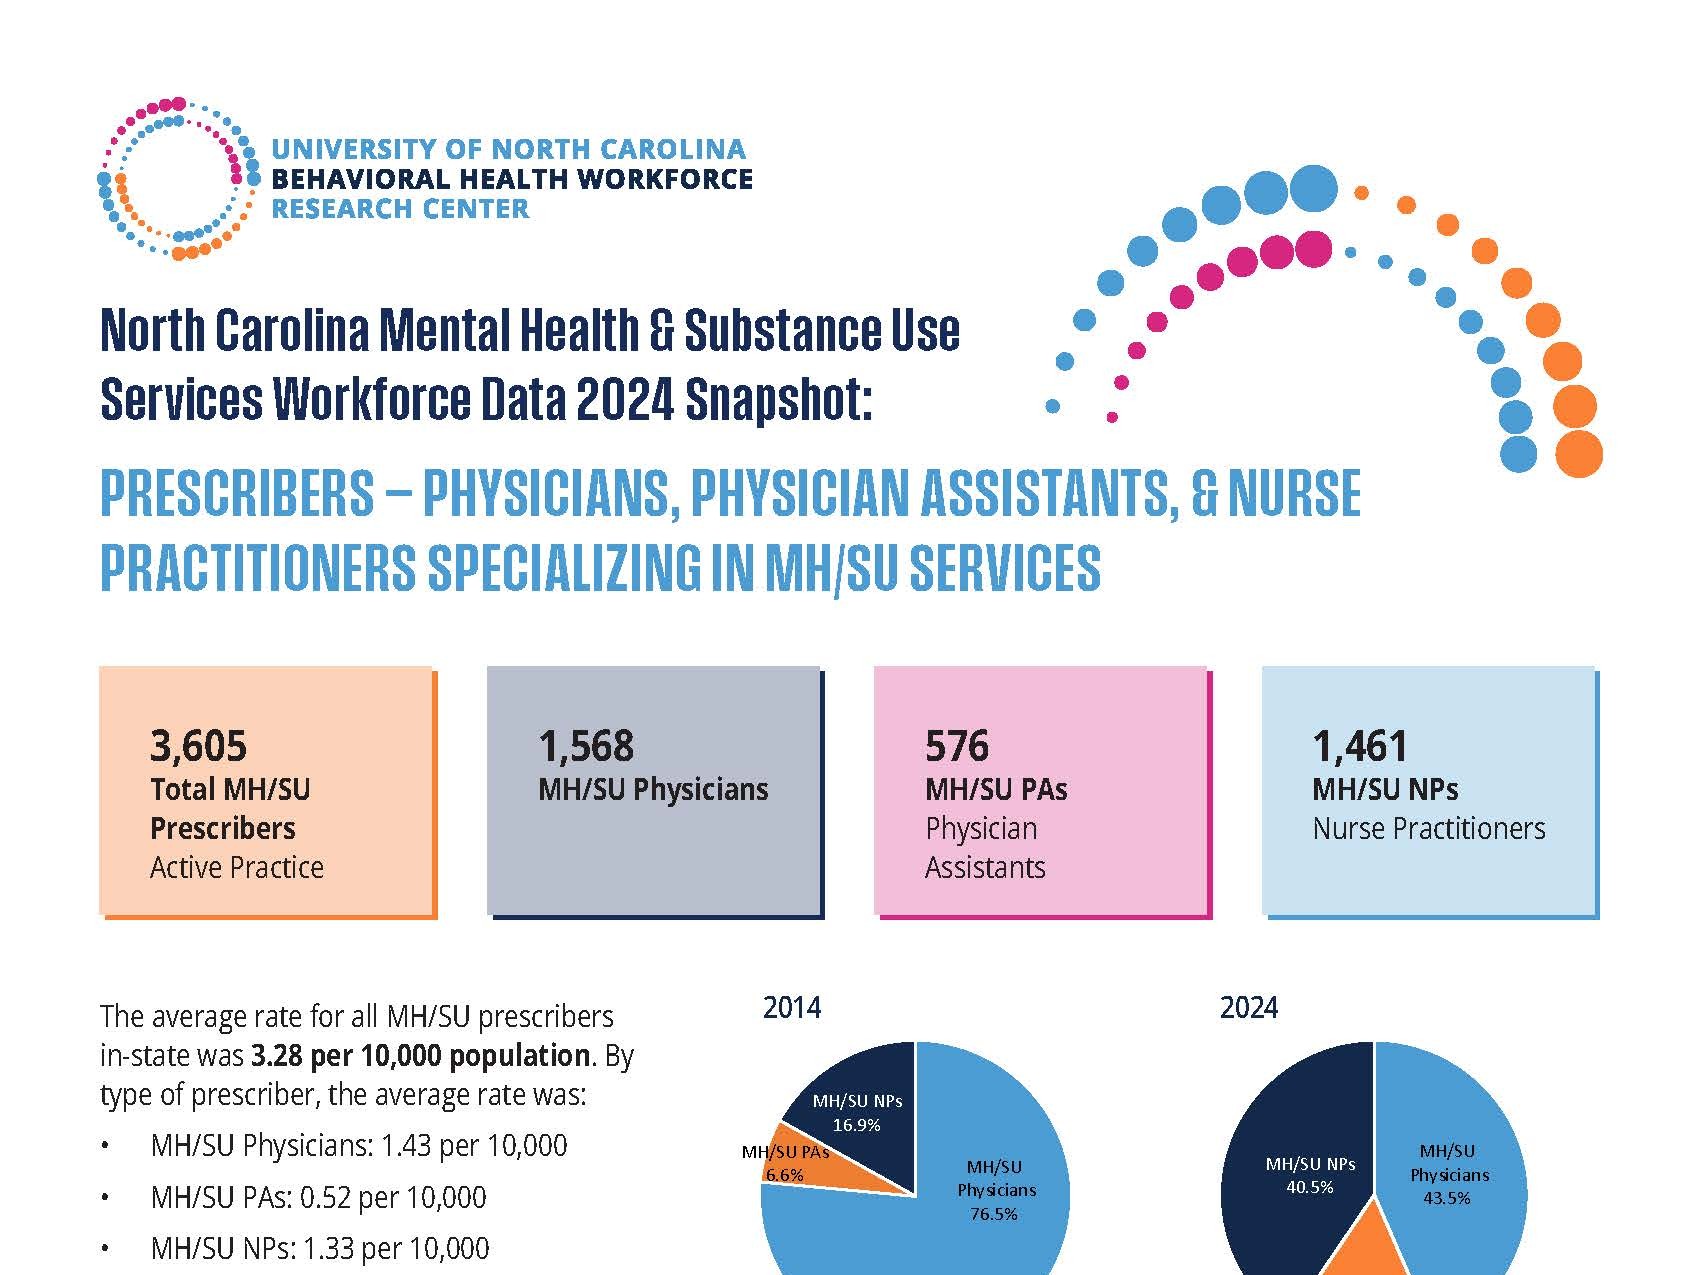
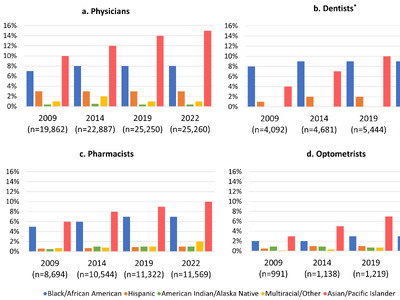
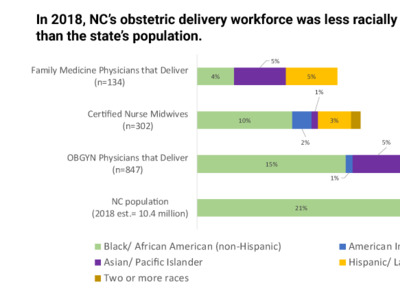
Physicians. Physicians had the highest percentage of individuals who identify as Asian/Pacific Islander (15%) compared to 4% of the NC population, followed by 8% of physicians who identified as Black/African American, compared to 21% of the population. Less than 3% of physicians identified as Hispanic (3%), Multiracial/Other (1%) and American Indian (<0.5%).
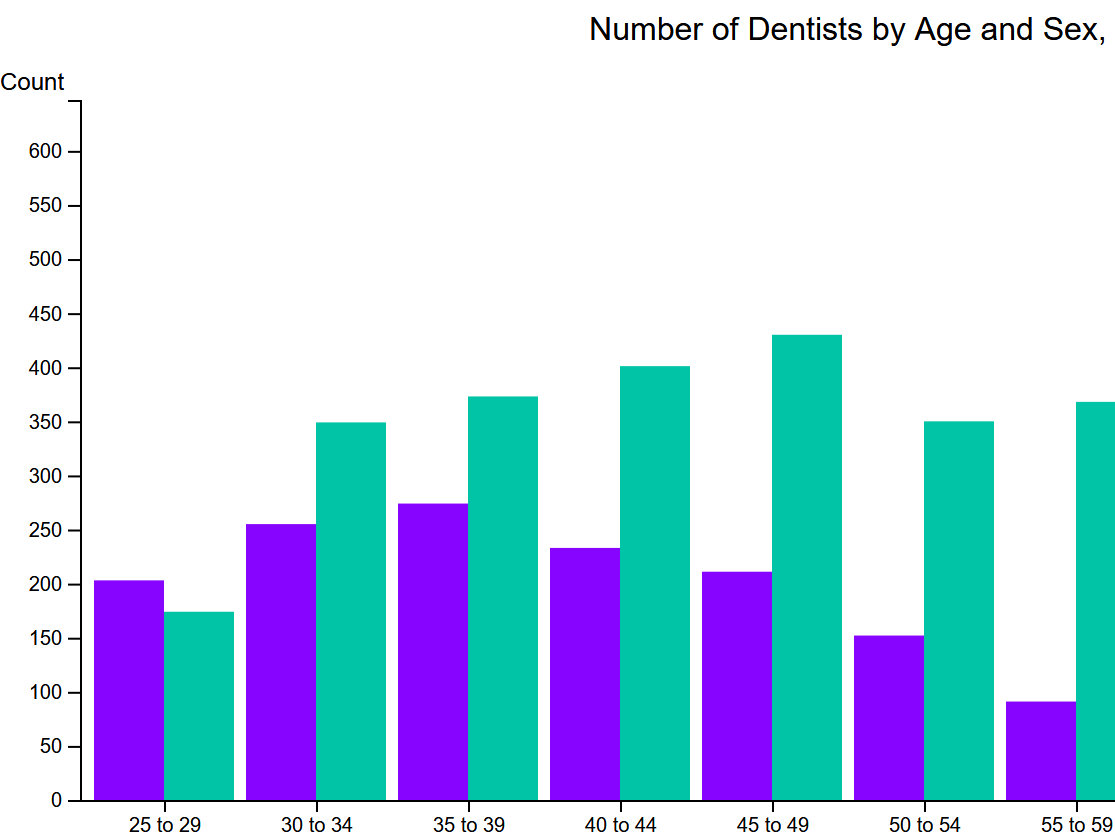
Dentists. There was an over representation of dentists who identified as Asian practicing in North Carolina relative to the population identifying as Asian in the State (11% vs 4% respectively). There was an under representation of dentists who identified as Black (9%), Hispanic (2%), and there were no reported Dentists who identified as Multiracial/Other. The NC Dental board does not collect data on American Indian/Alaska Native racial/ethnic identity and the representation of American Indian/Alaska Native dentists in NC is unknown.
Pharmacists. There was a higher proportion of pharmacists that identify as Asian/Pacific Islander than the NC population (10% vs. 4%). However, pharmacists were underrepresented for all other racial/ethnic groups including Black/African American (7% vs. 21%), Multiracial/other (2% vs. 4%), Hispanic (1% vs. 11%), and American Indian (0.6% vs. 2%).
Optometrists. Optometrists had the lowest percentage of individuals who identify as Black/African American (3%) among the eight professions studied. Less than 3% of the Optometrist workforce in the State identified as Hispanic (1%), American Indian (1%), and Multiracial/Other (1%). However, there were proportionally more Optometrists who identify as Asian (9%) than in the NC population (4%).
RNs. Of all licensed RNs in the State in 2022, 12% were Black/African American. Less than 9% of RNs identified as either Asian/Pacific Islander (4%), Hispanic (3%), American Indian/Alaska Native (1%), and Multiracial/Other (1%). RNs matched the State population proportion of individuals who identity as Asian/Pacific Islander (4%).
LPNs. LPNs had a higher proportion of individuals who identified as Black/African American when compared to the State population: 34% of LPNs identified as Black/African American compared to 21% of the state population. LPNs had the largest percentage of individuals who identified as American Indian/Alaska Native (2%) compared to all seven other professions and matched the state population (2%). LPNs had the lowest percentage of individuals who identified as Asian/Pacific Islander (1%) compared to the other professions and the State (4%).
PTs. PTs had a lower proportion of individuals who identified as Multiracial/Other (2%) than the state population (4%). There was a higher proportion of PTs that identified as Asian/Pacific Islander compared to the NC population (7% vs. 4%). Less than 6% of PTs identified as Black (4%), Hispanic (2%), or American Indian (<0.5%).
OTs. OTs fell short of matching the proportions of the State in all racial/ethnic categories. Less than 15% of OTs identified as Black/African American (7%), Asian/Pacific Islander (3%), Hispanic (2%), Multiracial/Other (2%), and American Indian (<0.5%).
To learn more about NC health workforce racial/ethnic diversity over time, please visit this blog post.
-
North Carolina Office of State Budget and Management. County/State Population Projections: Hispanic Origin by Race (2010-2050) and Sex, Race, Age Groups (2000-2050). Available from: https://www.osbm.nc.gov/facts-figures/population-demographics/state-demographer/countystate-population-projections ↩︎