Trends in the racial and ethnic diversity of NC health professions
By Brianna Lombardi, Haley Simons, Connor Sullivan, Evan Galloway, Erin Fraher
Mar 28, 2024
We examined how four of the North Carolina health professions' (physicians, dentists, pharmacists, and optometrists) diversity changed over time between 2009 and 2022. We compare the diversity of current NC practitioners (physicians, dentists, and pharmacists) with recent graduates (2017-2021). We also describe the racial/ethnic diversity of physicians and dentists that practice in NC that were educated in NC compared to those educated out-of-state.
How has the racial/ethnic diversity of selected NC health professions changed over time?
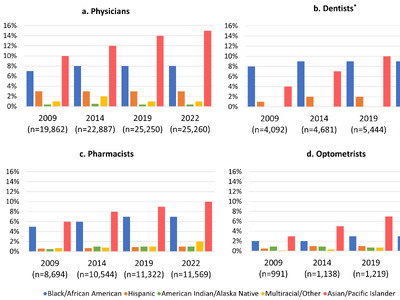
We examined if the racial/ethnic diversity of four professions (physicians, dentists, pharmacists, and optometrists) changed over time across a 12-year time period (2009, 2014, 2019 and 2022) (Figures 1a-d).
-
Each profession experienced an increase in the proportion of practitioners in at least two racial/ethnic categories between 2009 and 2022
-
However, there were minimal increases in the racial/ethnic diversity of NC physicians, dentists, pharmacists, and optometrists between 2009 and 2022
-
There was an increase of at least 4 percentage points in physicians, dentists, pharmacists, and optometrists who identified as Asian /Pacific Islander between 2009 and 2022
-
There was no increase in the proportion individuals in the physician workforce who identified as Hispanic, and a small increase in the proportion of dentists, pharmacists, and optometrists who identified as Hispanic
-
The proportion of practitioners who identified as Black/African American increased by 1 or more percentage point across all four professions
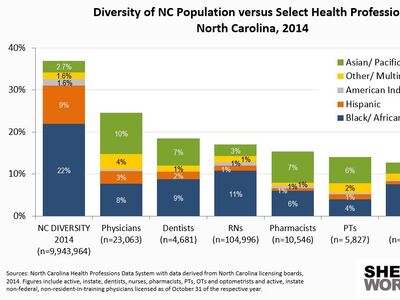
Physicians. The percentage of NC physicians who identified as Black/African American increased from 7% in 2009 to 8% in 2014 and remained constant at 8% across 2019 and 2022. Trends in Hispanic representation of the physician workforce remained consistent over the studied years at 3%. The percentage of NC physicians who identified as Asian/Pacific Islander increased across 2009 (10%), 2014 (12%), 2019 (14%) and 2022 (16%). Across all available years less than or equal to 0.5% of NC physicians identified as American Indian/Alaska Native. The percentage of NC physicians who identified as Multiracial/Other peaked in 2014 (2%), then fell to 1% in 2019 and 2022, matching the proportion in 2009.
Dentists. The percentage of NC dentists who identified as Black/African American increased from 8% in 2009 to 9% in 2014 and remained at 9% in both 2019 and 2022. The percentage of NC dentists who identified as Hispanic increased from 1% in 2009 to 2% in 2014 and remained at 2% in both 2019 and 2022. The percentage of NC dentists who identified as Multiracial/Other remained at 0% from 2009 to 2022. The percentage of NC dentists who identified as Asian/Pacific Islander increased from 4% in 2009 to 7% in 2014, 10% in 2019 and 11% in 2022. The NC Dental board does not collect data on the American Indian/Alaska Native racial/ethnic identity and the representation of American Indian/Alaska Native dentists in NC is unknown.
Pharmacists. The percentage of NC pharmacists who identified as Black/African American increased across 2009 (5%), 2014 (6%) and 2019 (7%) and remained constant in at 7% in 2022. The percentage of NC pharmacists who identified as Hispanic remained constant at ≤1% across all selected years. The percentage of NC pharmacists who identified as Multiracial/Other increased over time from <1% in 2009 and 2014 to 1% in 2019 and 2% in 2022. The percentage of NC pharmacists who identified as Asian/Pacific Islander was at its highest in 2022 at 10%, increasing from 6% in 2009, 8% in 2014, and 9% in 2019. The percentage of NC pharmacists who identified as American Indian/Alaska Native increased from 0.5% in 2009 to 1% in 2014 and remained at 1% in 2019 and 2022.
Optometrists. The percentage of NC optometrists who identified as Black/African American increased from 2% in 2009 and 2014 to 3% in 2019 and remained at 3% in 2022. The percentage of NC optometrists who identified as Hispanic remained constant at 1% across 2014, 2019 and 2022, increasing from 0.5% in 2009. The percentage of NC optometrists who identified as Multiracial/Other increased from 0.1% in 2009, 0.3% in 2014, 0.7% in 2019 to 1% in 2022. The percentage of NC optometrists who identified as Asian/Pacific Islander increased from 3% in 2009, 5% in 2014, 7% in 2019 to 8% in 2022. The percentage of NC optometrists who identified as American Indian/Alaska Native remained ≤1% across 2014, 2019 and 2022.
Figure 1a-d. Racial/Ethnic Diversity of NC Physicians, Dentists, Pharmacists, and Optometrists across 2009, 2014, 2019, 2022
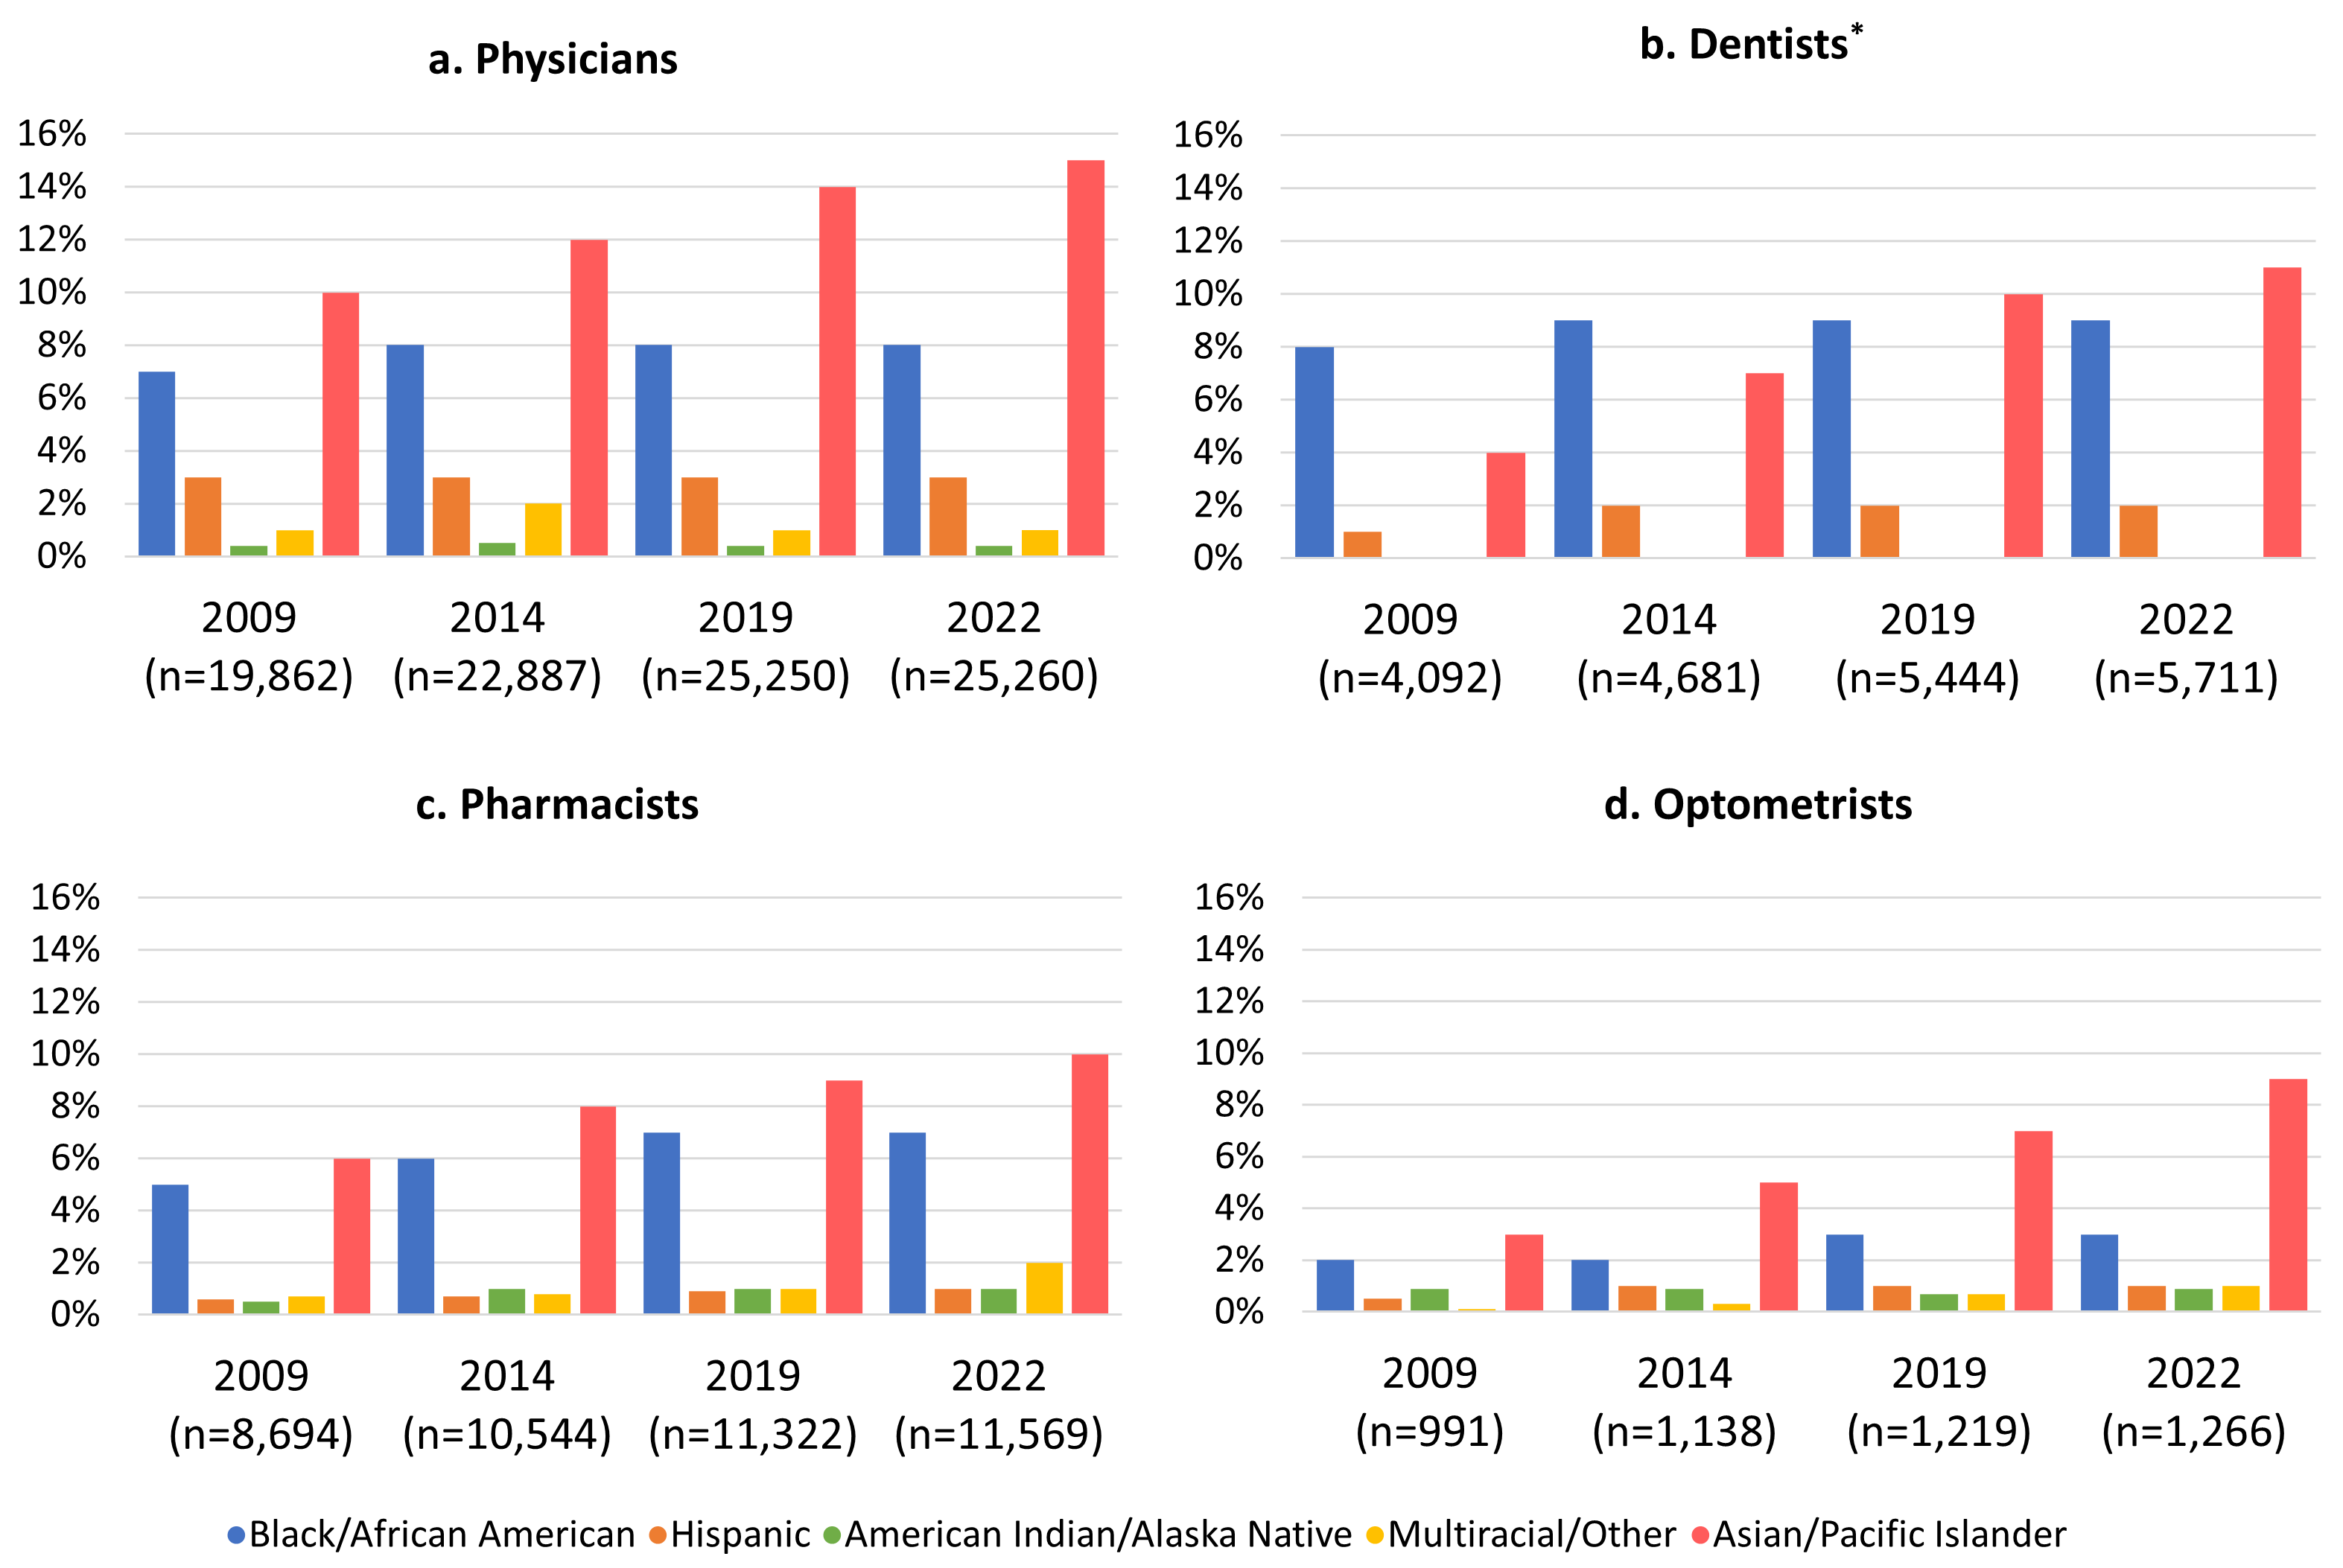
Source: North Carolina Health Professions Data System with data derived from North Carolina licensing boards, 2009, 2014, 2019, and 2022. Figures include active, instate non-federal, non-resident-in-training physicians, pharmacists, dentists, and optometrists licensed as of October 31, 2022. These data examine the practitioners who reported race/ethnicity data to their respective North Carolina state board. * The North Carolina State Board of Dental Examiners does not collect data on the American Indian/Alaska Native racial/ethnic category.
What is the racial/ethnic composition of new health profession graduates?
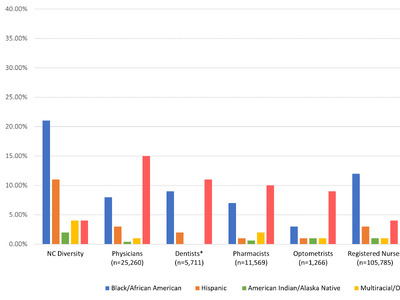
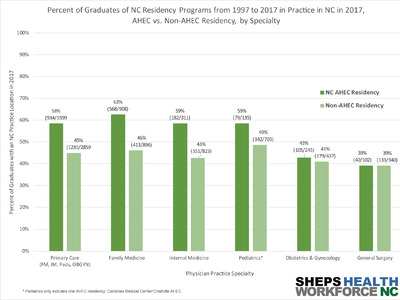
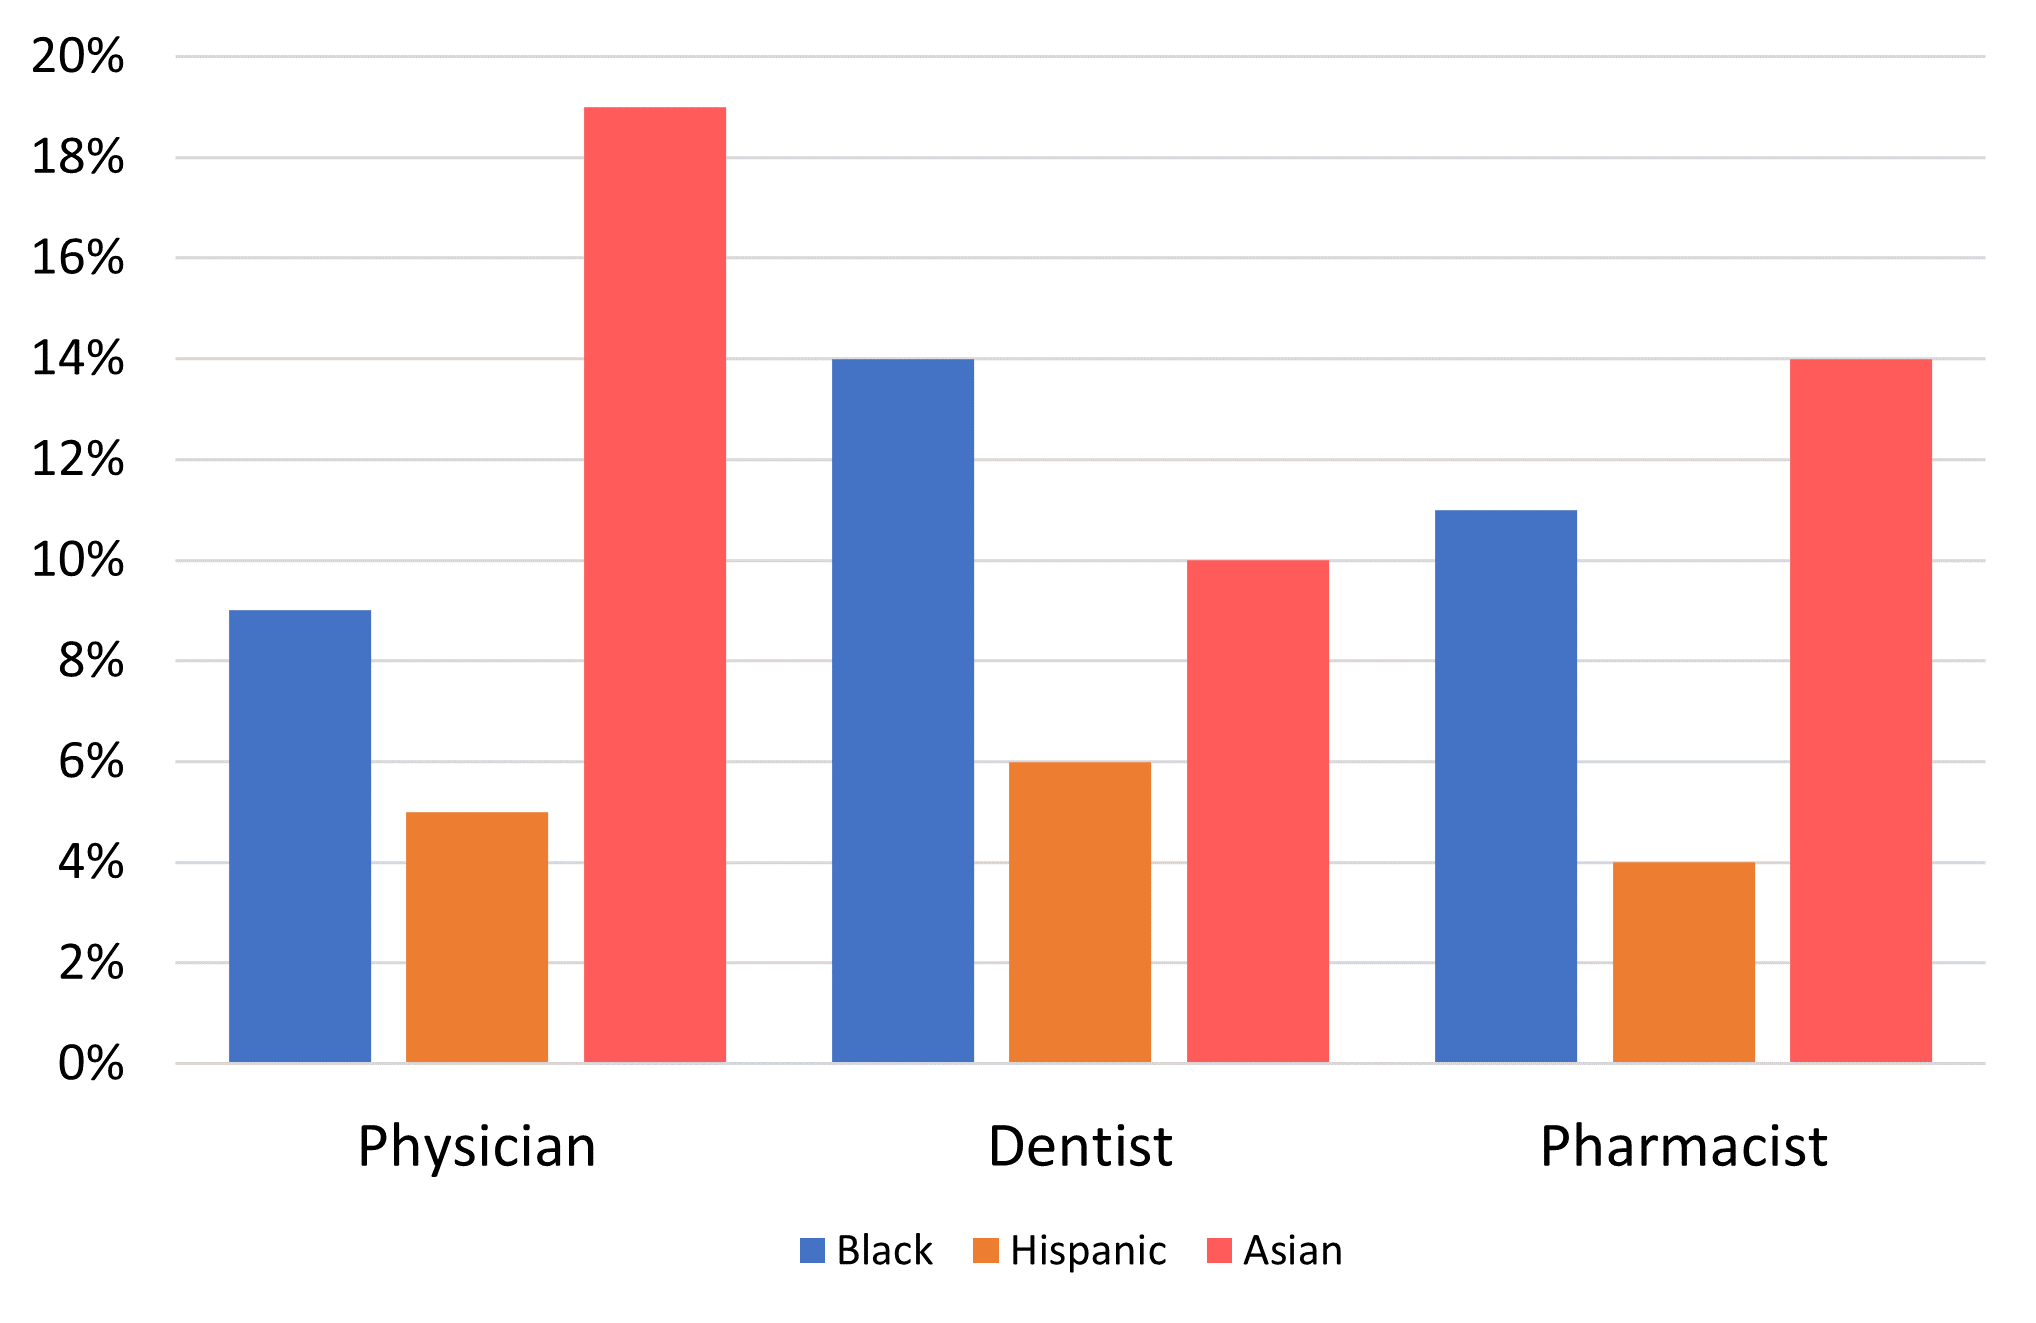
We examined the racial/ethnic diversity of recent (2017-2021) graduates of NC health professions educational programs to assess possible future trends of the NC health workforce. Using data from the Fitzhugh Mullen Institute Health Workforce Diversity Tracker showed that recent graduates (2017-2021) of physician, pharmacist, and dental programs in North Carolina are almost all more diverse than the 2022 active NC workforce in the professions included in this analysis.1 The Diversity Tracker uses three categories for race/ethnicity including Black, Hispanic, and Asian1 with no information on American Indian or Multiracial groups (Figure 2).
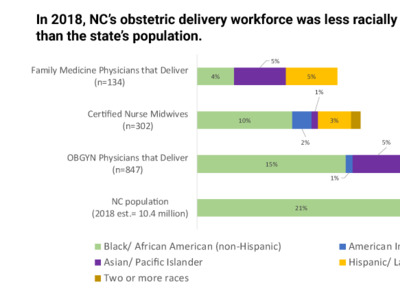
Physicians. Of the recent graduates of NC schools of medicine between 2017 and 2022, 8% identified as Black which is the same as the 2022 physician workforce in NC (8%).1 This suggests that there is not an increasing proportion of medical school graduates that identify as Black/African American that will increase the diversity of the future physician workforce. There were more recent graduates of NC schools of medicine that identified as Hispanic than in the current NC physician workforce (5% vs. 3%), however, this increase is not representative of the 11% of the State’s population that identified as Hispanic.12 Of the recent NC graduates from schools of medicine, 19% of new NC graduates identified as Asian as compared to 15% of 2022 NC physicians and 4% of the 2022 NC population who identified as Asian/Pacific Islander.12
Dentists. Of the recent graduates of NC dental schools between 2017 and 2022, 6% identified as Hispanic and 14% identified as Black, compared 2% of NC dentists in 2022 that identify as Hispanic and to 9% who identified as Black1. This finding suggests that there was a higher proportion of dental school graduates that identified as Black and Hispanic than the current workforce, however these increases do not yet reflect the racial/ethnic diversity of the State in 2022. There were 11% of NC dentists in 2022 that identified as Asian compared to 10% of NC dental graduates between 2017 and 20221, compared to 4% of the 2022 NC population.12
Pharmacists. Of the recent graduates of NC pharmacy schools between 2017 and 2022, 4% identified as Hispanic and 11% identified as Black, compared 1% of NC pharmacists in 2022 that identified as Hispanic and to 7% who identified as Black/African American.1 This finding suggests that there is a higher proportion of pharmacy school graduates that identified as Black/African American and Hispanic than the current workforce, however these increases do not yet reflect the racial/ethnic diversity of the State in 2022. Of the recent NC graduates from pharmacy schools, 14% of new NC graduates identified as Asian which is a higher proportion of current NC pharmacists who identify as Asian (10%).1
Figure 2. Racial/Ethnic Diversity of NC Recent Graduates (2017-2021)
Source: Fitzhugh Mullan Institute for Health Workforce Equity. Health Workforce Diversity Tracker. Washington, DC: George Washington University, 2023 with data from The American Community Survey (ACS) for the period of 2017-2021 and the U.S Integrated Post-Secondary Education Data System (IPEDS) for the period of 2017-2021.
What proportion of the health professionals who are racially/ethnically diverse are educated in North Carolina?
We examined trends in the proportion of physicians and dentists in active practice in North Carolina in 2022, by race/ethnicity, who were educated in North Carolina versus out-of-state (Figure 3-4).
Physicians. The majority of physicians licensed to practice in NC in 2022 attended medical school in North Carolina (86% out-of-state vs. 14% in-state). As such, across all racial/ethnic groups there were more individuals educated out-of-state than within North Carolina. For example, 16% of Black/African American, 9% of Hispanic, 9% of Asian/Pacific Islander, 13% Multiracial/Other and 16% of White physicians who are licensed to practice in NC in 2022 were educated in NC. However, about half (48%, n=48) of physicians who identified as American Indian/Alaska Native were educated in-state—close to 3 times higher than any other racial/ethnic group. These findings reflect that although recent graduates of NC medical schools are increasingly from diverse racial/ethnic groups the majority of racial/ethnic diverse physicians are educated out-of-state.
Dentists. A significantly greater proportion of dentists who practice in NC in 2022 were educated in NC compared to physicians. In 2022, approximately 44% of dentists in active practice in NC graduated from an in-state dental school. There were some differences across racial/ethnic groups. For example, 39% of active NC dentists who identified as Black/African American were educated out-of-state as compared to 61% of those educated in-state. Similarly, 26% of active NC dentists who identified as Hispanic were educated in NC as compared to 74% educated outside of NC. However, 48% of NC dentists who identified as White were educated in NC as compared to 52% trained out-of-state. Of active NC dentists in 2022, those who were educated outside of North Carolina are more diverse than those educated in-state.
Figure 3. Proportion of 2022 NC Physicians Who Graduated from Medical School in NC Compared to Out-of-State by Race/Ethnicity
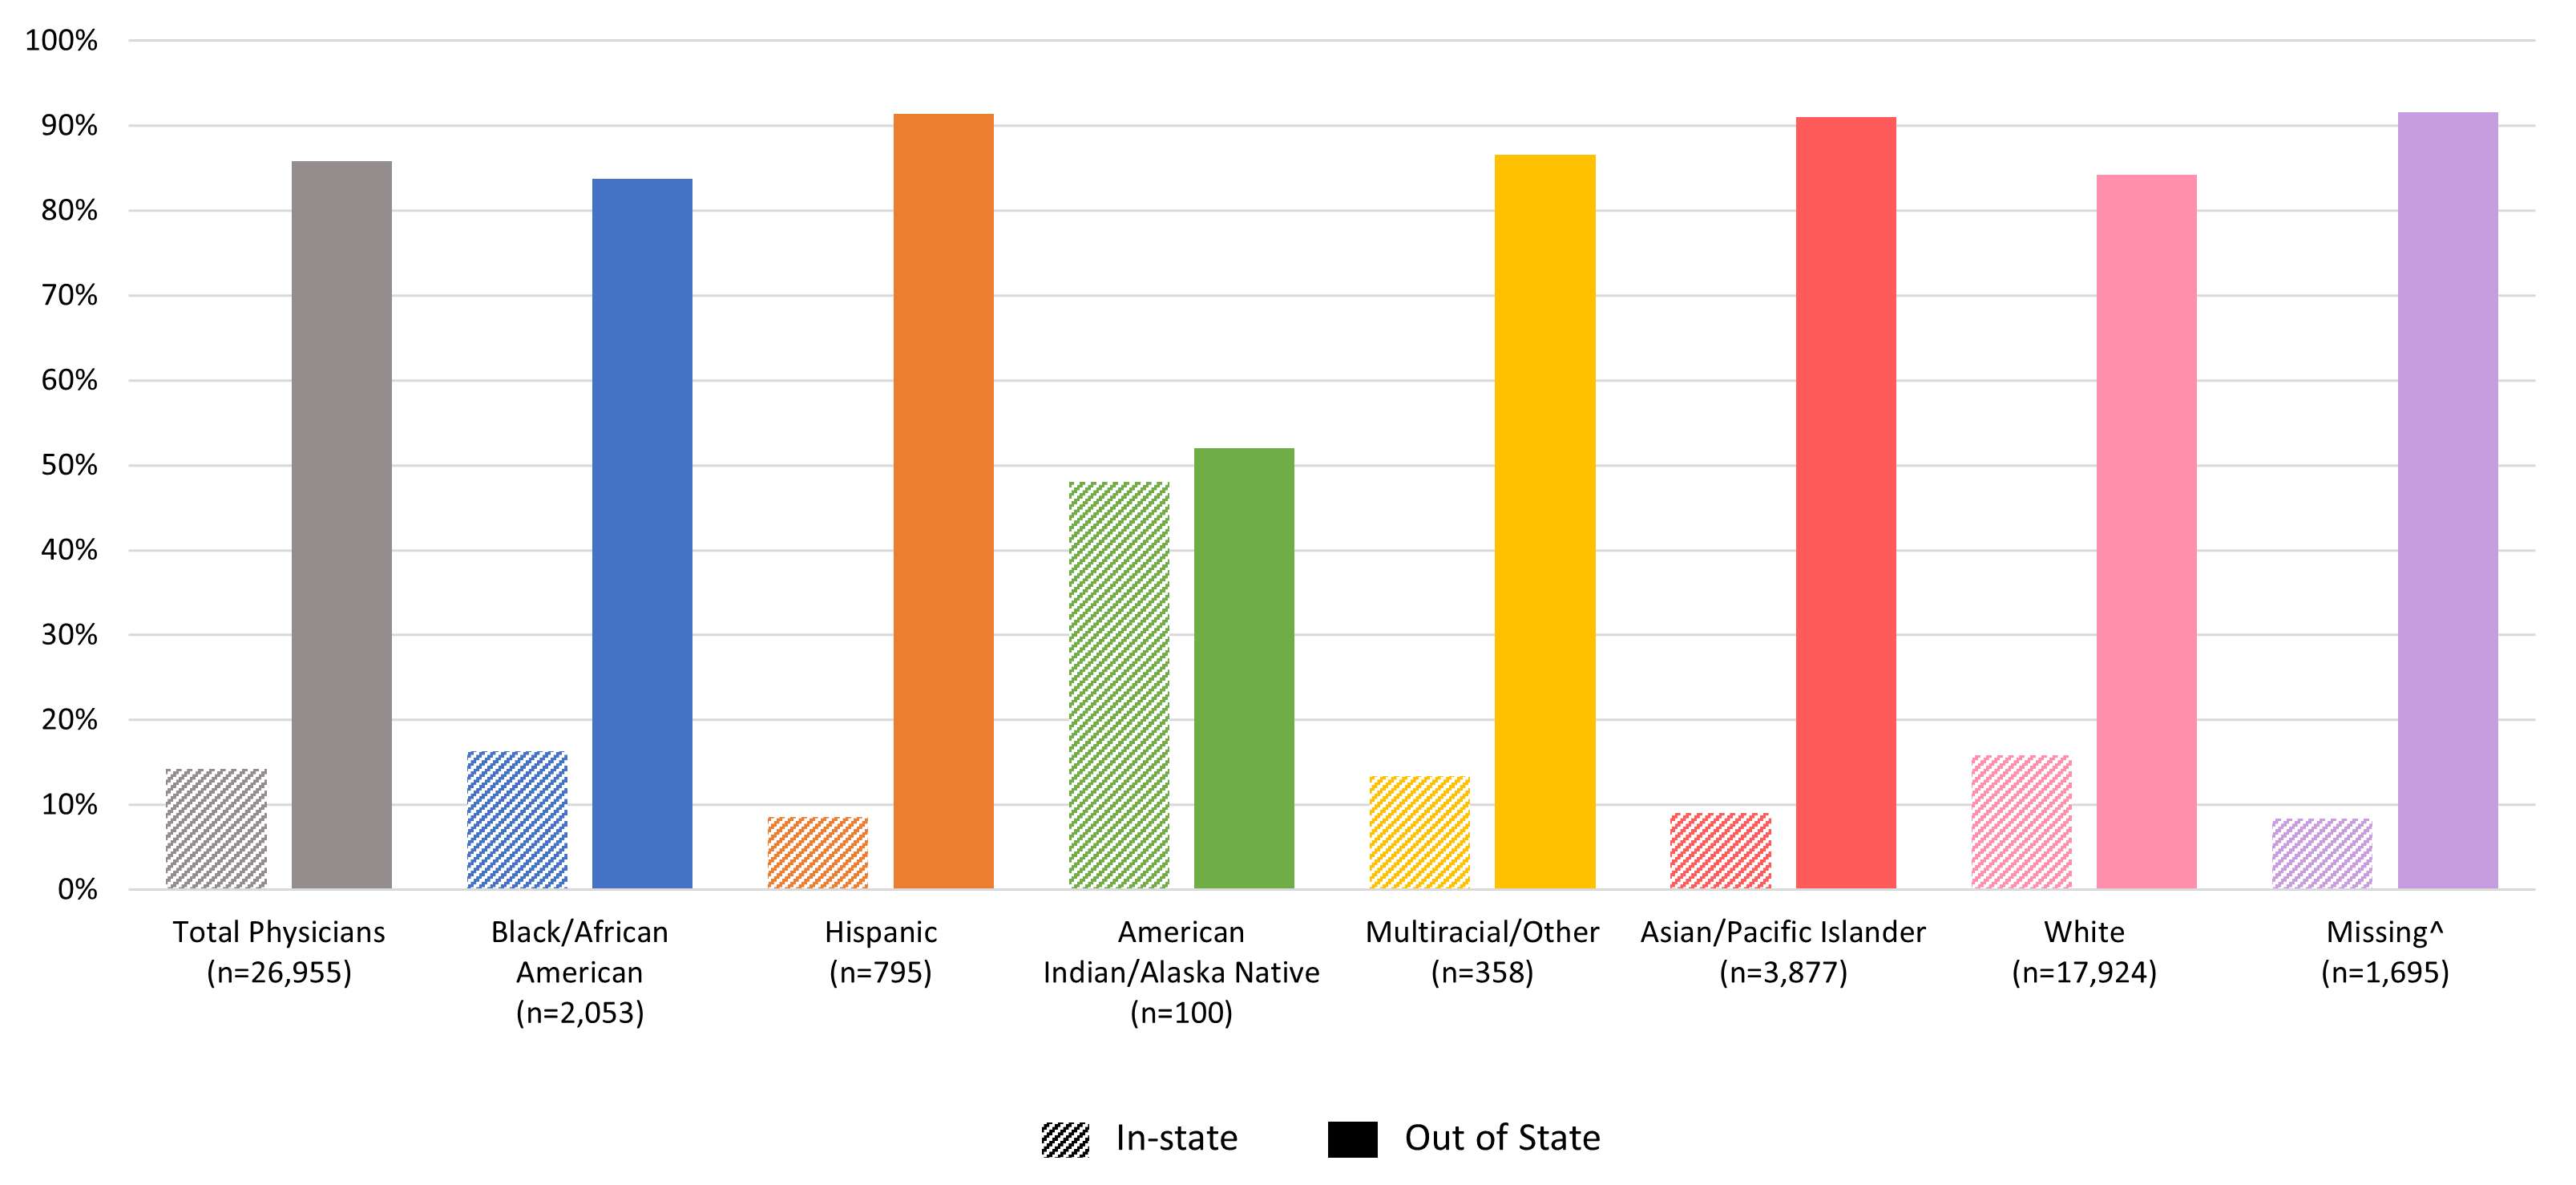
Source: North Carolina Health Professions Data System with data derived from North Carolina licensing boards, 2022. Figure includes active, instate non-federal, non-resident-in-training dentists licensed as of October 31, 2022. Missing data dentists who did not have an associated racial/ethnic identity in 2022. These do not include the physicians who selected ‘Prefer No Answer’ (n=153). ^ Missing data represent include active, instate non-federal, non-resident-in-training physicians who did not have an associated racial/ethnic identity in 2022.
Figure 4. Proportion of 2022 NC Dentists Who Graduated from Dental School in NC Compared to Out-of-State by Race/Ethnicity
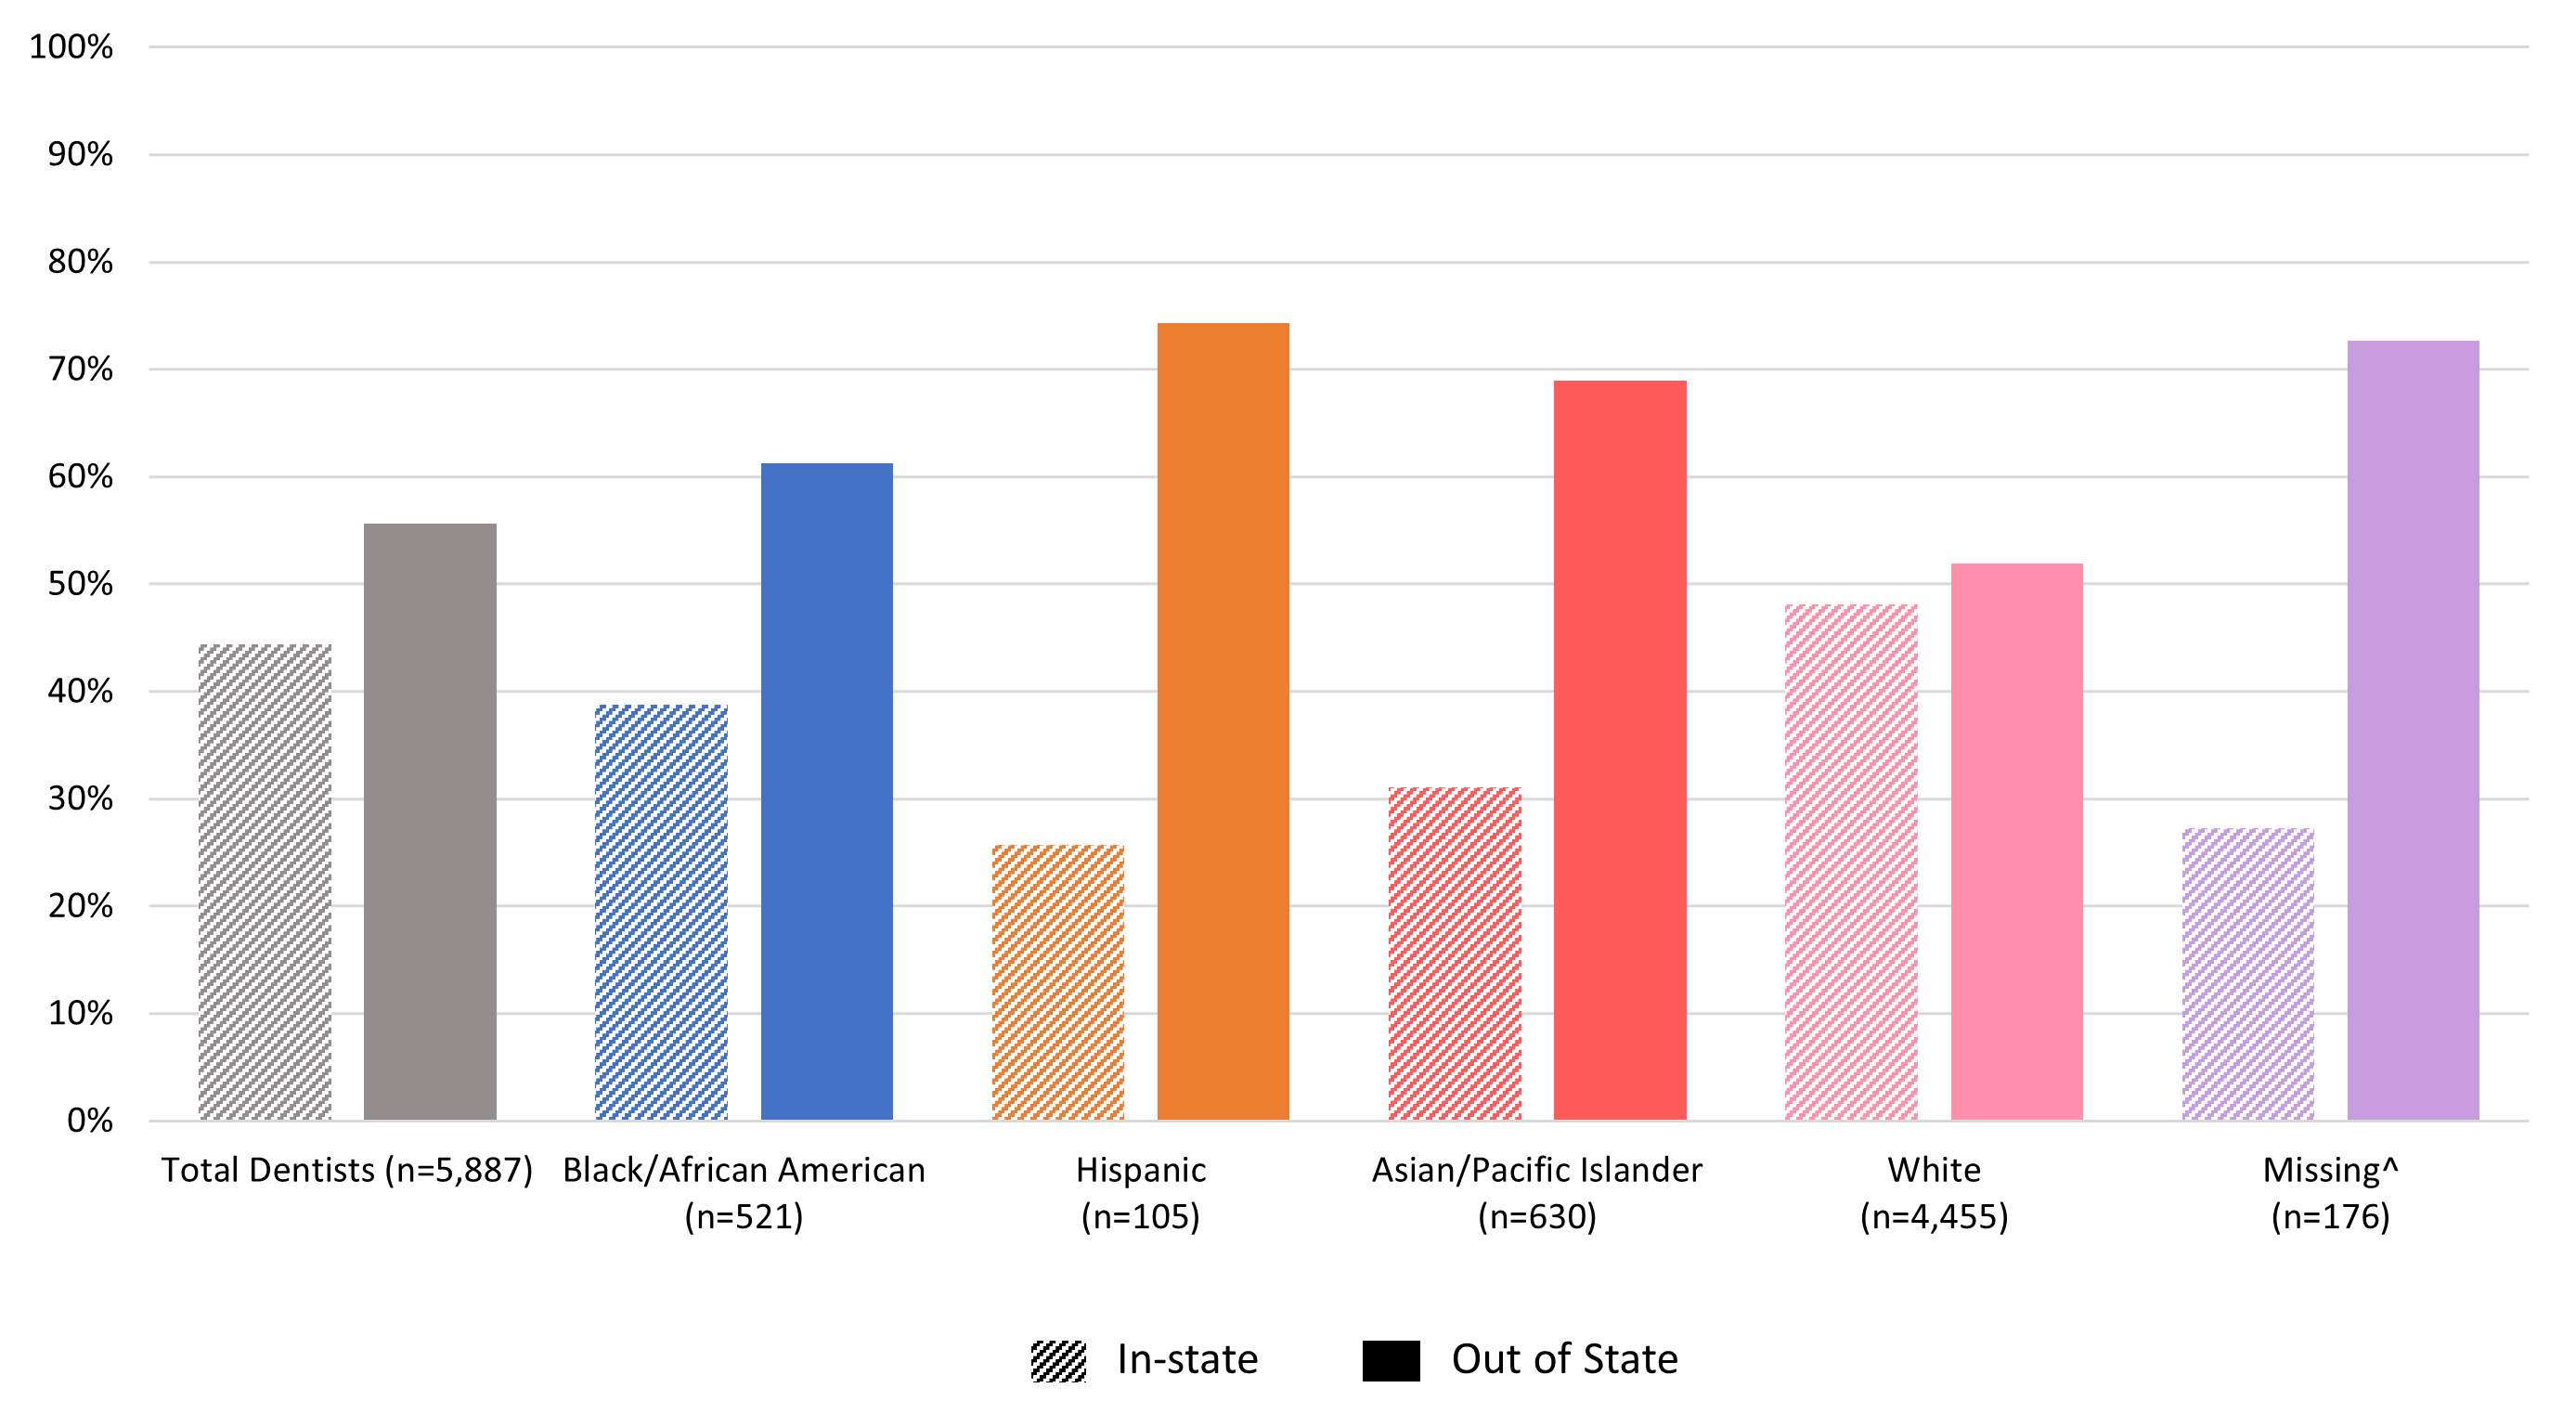
Source: North Carolina Health Professions Data System with data derived from North Carolina licensing boards, 2022. Figure includes active, instate non-federal, non-resident-in-training dentists licensed as of October 31, 2022. The North Carolina State Board of Dental Examiners does not collect data on the American Indian/Alaska Native racial/ethnic category. ^ Missing data represent include active, instate non-federal, non-resident-in-training physicians who did not have an associated racial/ethnic identity in 2022.
Conclusion
Although the North Carolina population is increasingly racially/ethnically diverse, most of the NC health professions included in this report are not representative of the State population. Some professions have had small increases in the proportion of individuals who are racially/ethnically diverse between 2009 and 2022, yet other professions have had no increases or experienced decreases in the diversity of the workforce. The majority of health professionals studied in this report are educated out-of-state, as such most of the racial/ethnic diverse health professionals are also educated out-of-state. The data included in this brief are derived from the North Carolina HPDS which has collected data on the demographic characteristics of the licensed health workforce for over 40 years. Evidence supports that a racially/ethnically diverse health workforce that is representative of the community they serve improves health outcomes.345 Tracking trends in the data are critical to help inform policy makers, educators, employers, and others who are interested in recruiting and retaining a workforce that meets population health needs in North Carolina.
Trends in racial/ethnicity data: missing over time
One concerning observation from these data is the increase in missing data related to the race/ethnicity of the health workforce since 2018. In 2022, 6.3% (n=1,695) of the total physicians in the state are missing their associated racial/ethnic data, along with 3% (n=176) of the state’s total dentists. Missing racial/ethnic data limits our ability to monitor trends and develop policy to recruit and retain a workforce that represents the racial and ethnic diversity of North Carolina’s population. Another limitation of these data are the differences in how NC health professions boards collect racial/ethnic data, with varying question types, categories and question structures which can make comparing racial/ethnic data across professions and over time difficult. Lastly, in some cases, ethnicity is separated from race while in other racial/ethnic categories are offered together in one question. The data in this brief provide a description of race/ethnicity based on the data that are available and self-reported to the professional board by licensees. To observe trends in missing data for race/ethnicity in HPDS please visit our health professions supply visualization.
To learn more about 2022 NC health workforce racial/ethnic diversity, please visit this blog post.
-
Fitzhugh Mullan Institute for Health Workforce Equity. Health Workforce Diversity Tracker. Washington, DC: George Washington University, 2023. www.gwhwi.org/diversitytracker.html. ↩︎ ↩︎ ↩︎ ↩︎ ↩︎ ↩︎ ↩︎ ↩︎ ↩︎ ↩︎
-
North Carolina Office of State Budget and Management. County/State Population Projections: Hispanic Origin by Race (2010-2050) and Sex, Race, Age Groups (2000-2050). Available from: https://www.osbm.nc.gov/facts-figures/population-demographics/state-demographer/countystate-population-projections ↩︎ ↩︎ ↩︎
-
Jetty, A., Jabbarpour, Y., Pollack, J. et al. Patient-Physician Racial Concordance Associated with Improved Healthcare Use and Lower Healthcare Expenditures in Minority Populations. J. Racial and Ethnic Health Disparities 9, 68–81 (2022). https://doi.org/10.1007/s40615-020-00930-4 ↩︎
-
Kington R, Tisnado D, Carlisle DM. Increasing racial and ethnic diversity among physicians: an intervention to address health disparities. The right thing to do, the smart thing to do: Enhancing diversity in the health professions. National Academies Press. 2001 Sep 29:57-90. ↩︎
-
Takeshita J, Wang S, Loren AW, et al. Association of Racial/Ethnic and Gender Concordance Between Patients and Physicians With Patient Experience Ratings. JAMA Netw Open. 2020;3(11):e2024583. doi:10.1001/jamanetworkopen.2020.24583 ↩︎