2024 Health Workforce Update: Insights from the North Carolina Health Professions Data System
By Abhi Joshi, Catherine Moore, Brooke Lombardi
Sep 17, 2025
The NC Health Supply Data Dashboard has been recently updated with 2024 data.
This blog presents select findings from the 2024 data and includes an overview of changes to physician, oral health, pharmacy, and nursing workforces in active practice in North Carolina (NC). We also highlight a recent change to the HPDS supply visualization tool, which now allows users to track changes in both certified nurse midwives who practice under a collaborative practice agreement with physicians and those who are independently practicing in the state (see our last blog for more information on the recent legislative changes).
Physicians
- The physician workforce increased by 24.5% (23,063 to 28,709) between 2014 and 2024 while the NC population grew 11.2% (from 9,881,906 to 10,984,106) during the same period. The ratio of physicians to NC population grew 12%, from 23.3 physicians per 10,000 (10k) population to 26.1 per 10k population.
- Table 1 shows growth from 2014 to 2024 for the 10 physician specialties with the largest headcount in 2024. Among these specialties, hospitalists had the highest percentage increase (68%). Also notable was the 32.2% increase in family medicine physicians.
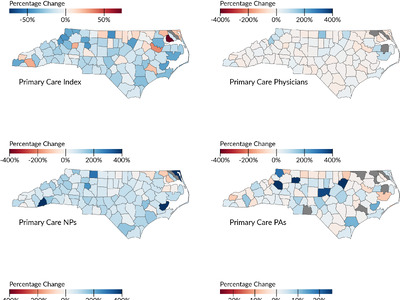
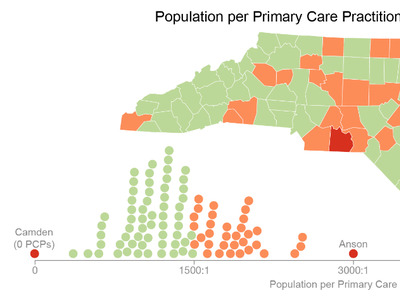
- A recent primary care clinician blog showed that the ratio of primary care clinicians (including physicians, nurse practitioners, physician assistants and certified nurse midwives) to the population in the state improved between 2017 to 2023, but cautioned that individuals may still experience difficulty in obtaining primary care services as a result of other factors (e.g. socioeconomic factors, lack of insurance).
- A concerning trend is the slow growth in general pediatricians over the last 10 years, which has not kept pace with the growth in the NC population. North Carolina has experienced a slight decline in general pediatricians per capita, from 1.62 to 1.58 general pediatricians per 10k population between 2014 and 2024.
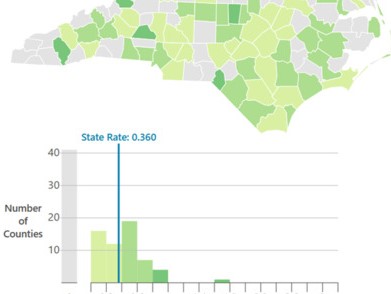
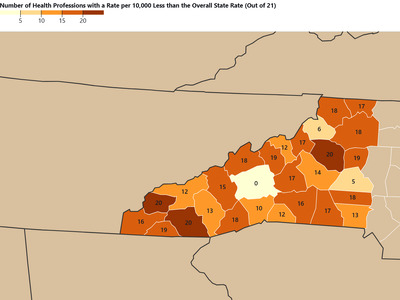
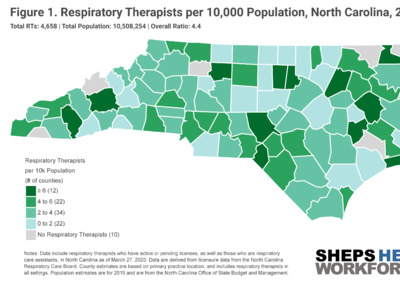
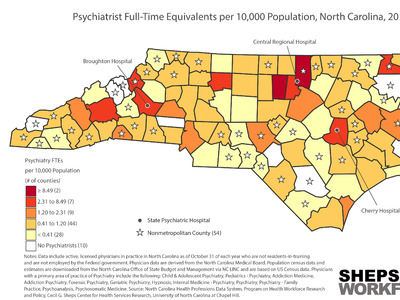
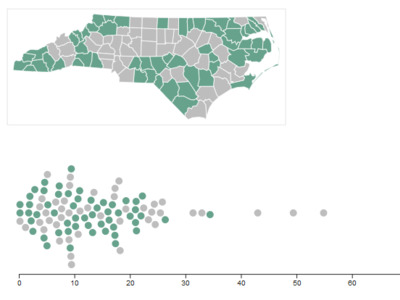
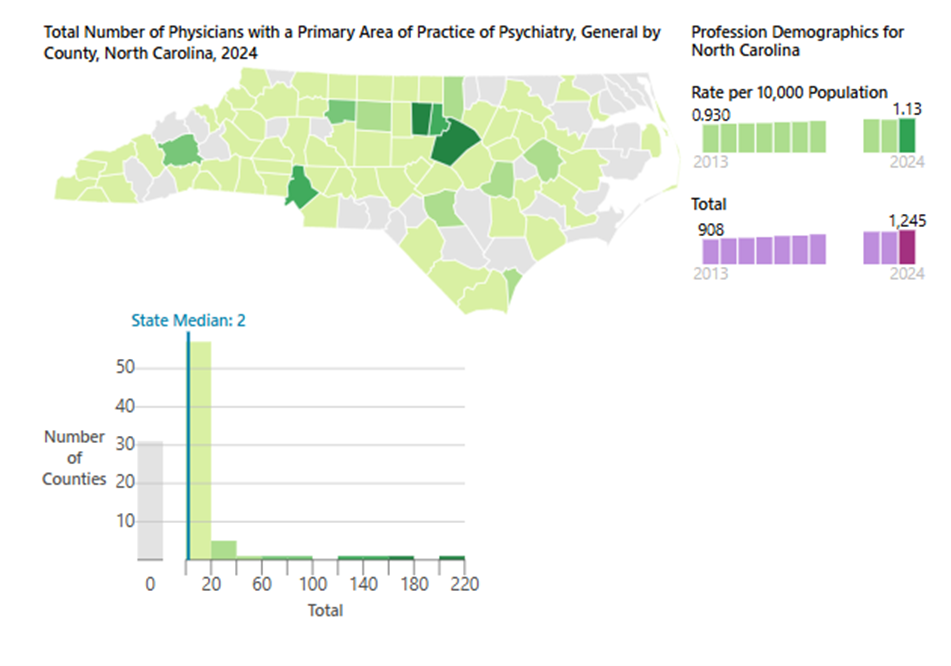
- There were 1,568 psychiatrists in active practice in the state in 2024, an increase of 25.9% since 2014 (psychiatry specialties include child & adolescent psychiatry, pediatrics - psychiatry, addiction medicine, addiction psychiatry, forensic psychiatry, geriatric psychiatry, hypnosis, internal medicine - psychiatry, psychiatry, psychiatry - family practice, psychoanalysis, and psychosomatic medicine). Relative to population, the ratio of psychiatrists per 10k population increased from 1.26 to 1.43 between 2014 and 2024. Psychiatry specialties remain maldistributed across NC, with 25 counties in 2024 having no psychiatrists who reported a primary practice location within the county, which can limit access to mental health care for rural and underserved populations (Figure 1).
Table 1. Growth in Top Ten NC Physician Specialties, 2014-2024
| Primary Area of Practice | 2014 Total | 2024 Total | % Change | 2014 Rate per 10k | 2024 Rate per 10k |
|---|---|---|---|---|---|
| Hospitalist | 947 | 1,591 | 68.0% | 0.96 | 1.45 |
| Emergency Medicine | 1,241 | 1,741 | 40.3% | 1.26 | 1.59 |
| Anesthesiology | 953 | 1,268 | 33.1% | 0.96 | 1.15 |
| Family Medicine** | 2,506 | 3,314 | 32.2% | 2.54 | 3.02 |
| Cardiology | 749 | 978 | 30.6% | 0.76 | 0.89 |
| Psychiatry, All Specialties* | 1,245 | 1,568 | 25.9% | 1.26 | 1.43 |
| Radiology | 1,173 | 1,445 | 23.2% | 1.19 | 1.32 |
| General OB/GYN** | 1,087 | 1,302 | 19.8% | 1.10 | 1.19 |
| Internal Medicine** | 2,024 | 2,372 | 17.2% | 2.05 | 2.16 |
| General Pediatrics** | 1,603 | 1,731 | 8.0% | 1.62 | 1.58 |
*Physicians with a primary area of practice of “psychiatry, all specialties” include child & adolescent psychiatry, pediatrics - psychiatry, addiction medicine, addiction psychiatry, forensic psychiatry, geriatric psychiatry, hypnosis, internal medicine - psychiatry, psychiatry, psychiatry - family practice, psychoanalysis, and psychosomatic medicine. **Includes physicians who are in primary care specialties. Note. Data include active, licensed physicians in practice in North Carolina as of October 31 of each year who are not residents-in-training and are not employed by the Federal government. Physician data are derived from the North Carolina Medical Board. County estimates are based on primary practice location. Data from 2020 and 2021 are unavailable. Population census data and estimates are downloaded from the North Carolina Office of State Budget and Management via NC LINC and are based on US Census data.
Figure 1. Rate per 10,000 population of Physicians with a Primary Practice Area of Psychiatry, All Specialties, in North Carolina, 2024
Note. Data include active, licensed physicians in practice in North Carolina as of October 31 of each year. Data are derived from the North Carolina State Board of Medical Examiners. Population census data and estimates are downloaded from the North Carolina Office of State Budget and Management via NC LINC and are based on US Census data.
Note. Physicians with a primary area of practice of “psychiatry, all specialties” include child & adolescent psychiatry, pediatrics - psychiatry, addiction medicine, addiction psychiatry, forensic psychiatry, geriatric psychiatry, hypnosis, internal medicine - psychiatry, psychiatry, psychiatry - family practice, psychoanalysis, and psychosomatic medicine. Data include active, licensed physicians in practice in North Carolina as of October 31 of each year who are not residents-in-training and are not employed by the Federal government. Physician data are derived from the North Carolina Medical Board. County estimates are based on primary practice location. Data from 2020 and 2021 are unavailable. Population census data and estimates are downloaded from the North Carolina Office of State Budget and Management via NC LINC and are based on US Census data.
Oral Health Workforce
- From 2014 to 2024, the total number of dentists increased by 33.3% (4,681 to 6,241) while the number of dental hygienists increased by 17% (5,798 to 6,784).
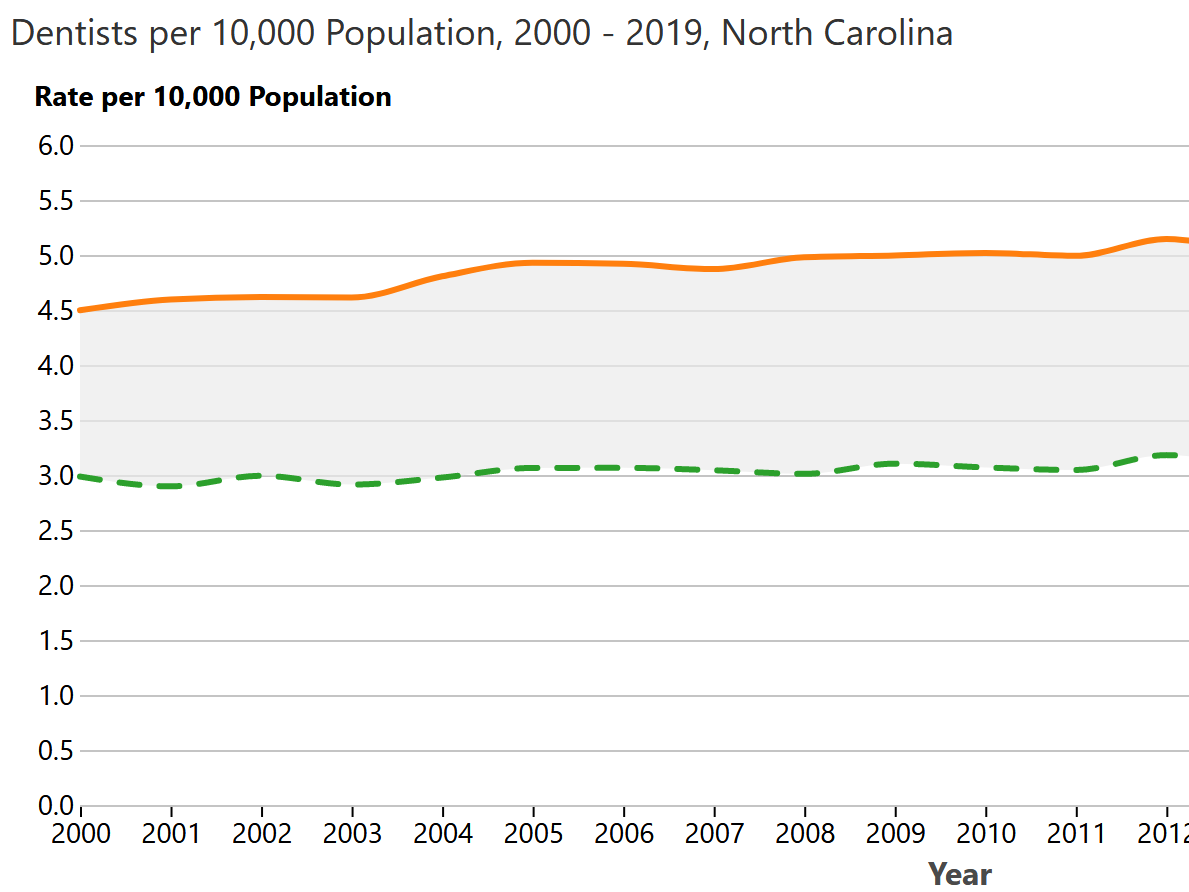
- Dentists per capita in NC increased from 4.74 to 5.68 per 10k population while dental hygienists per capita increased from 5.87 to 6.18 per 10k population from 2014 to 2024 (Figure 2).
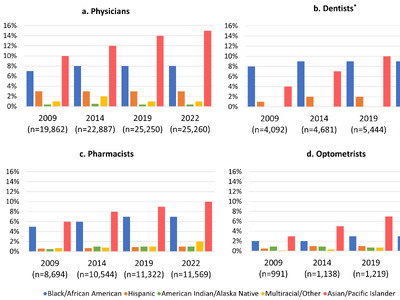
- A recent article highlighted changes in the NC oral workforce from 2000 to 2022 and noted continued geographic disparities in the distribution of these workforces across the state. Recent legislation (NC Session Law 2021-95) created a mechanism for teledentistry service reimbursement for dental hygienists who meet certain criteria to perform dental hygiene care based on a written standing order from a dentist. This change enabled dental hygienists to provide care without the requirement for the dentist to be physically present when services are provided.
Figure 2. Rate per 10,000 population of Dentists and Dental Hygienists in North Carolina, 2014-2024

Note. Data include active, licensed dentists and dental hygienists in practice in North Carolina as of October 31 of each year. Data are derived from the North Carolina State Board of Dental Examiners. Population census data and estimates are downloaded from the North Carolina Office of State Budget and Management via NC LINC and are based on US Census data.
- The most common specialty among dentists is general practice (5,106 in 2024). From 2014 to 2024, the percentage of dentists in general practice ranged from 77.3% to 81.8%, averaging 79.7% per year. The rate of dentists in general practice per 10k population increased from 3.66 in 2014 to 4.65 in 2024.
Pharmacists
- Although the number of pharmacists in NC increased by 14.3% from 10,546 in 2014 to 12,052 in 2024, the ratio of pharmacists per 10k population has remained relatively stable, increasing only slightly from 10.7 pharmacists per 10k population to 11.0 per 10k population in 2024 (Figure 3).
Figure 3. Rate per 10,000 population of Pharmacists in North Carolina, 2014-2024

Note. Data include active, licensed pharmacists in practice in North Carolina as of October 31 of each year. Data are derived from the North Carolina State Board of Pharmacy. Population census data and estimates are downloaded from the North Carolina Office of State Budget and Management via NC LINC and are based on US Census data.
Nursing
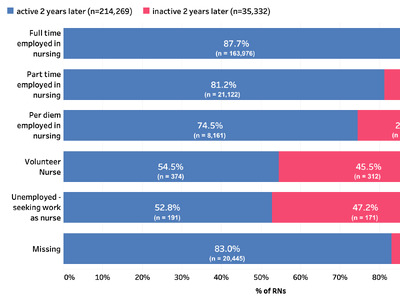
- In 2024, there were 120,266 registered nurses (RNs) in active practice in NC, a 20.6% increase from the 99,734 RNs in active practice in 2014.
- The licensed practical nurse (LPN) workforce in active practice experienced a 2.6% decline from 18,085 in 2014 to 17,618 in 2024. However, NC gained 256 LPNs in active practice between 2023 and 2024, a 1.5% increase.
- The ratio of RNs per 10k population increased from 101 in 2014 to 109 in 2024. For LPNs, the rate per 10k population decreased from 18.3 in 2014 to 16.0 in 2024 (Figure 4).
Figure 4. Rate per 10,000 population of Registered Nurses and Licensed Practical Nurses in North Carolina, 2014-2024

Note. Data include active registered nurses and licensed practical in practice in North Carolina as of October 31 of each year. Data are derived from the North Carolina State Board of Nursing. Population census data and estimates are downloaded from the North Carolina Office of State Budget and Management via NC LINC and are based on US Census data.
HPDS Supply Data Dashboard Update
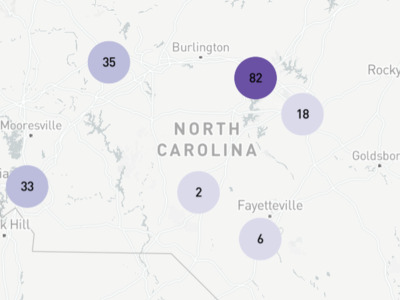
The NC Health Supply Data Dashboard has recently added a drop-down menu for the practice type of certified nurse midwives (CNM). This reflects a recent change in CNM regulation which allows CNMs who meet certain criteria to practice independently, without a collaborative practice agreement. To be approved as an independent CNM in NC, CNMs must complete at least 24 months and 4,000 hours of practice experience as a collaborative CNM. To read more about the legislative changes involving the NC CNM workforce, see this CNM blog. In the CNM section of the dashboard, users can now see both the number of CNMs in collaborative practice with a physician compared to those in independent practice (Figure 5).
Figure 5. 2024 Update to the Certified Nurse Midwives Interactive Visualization
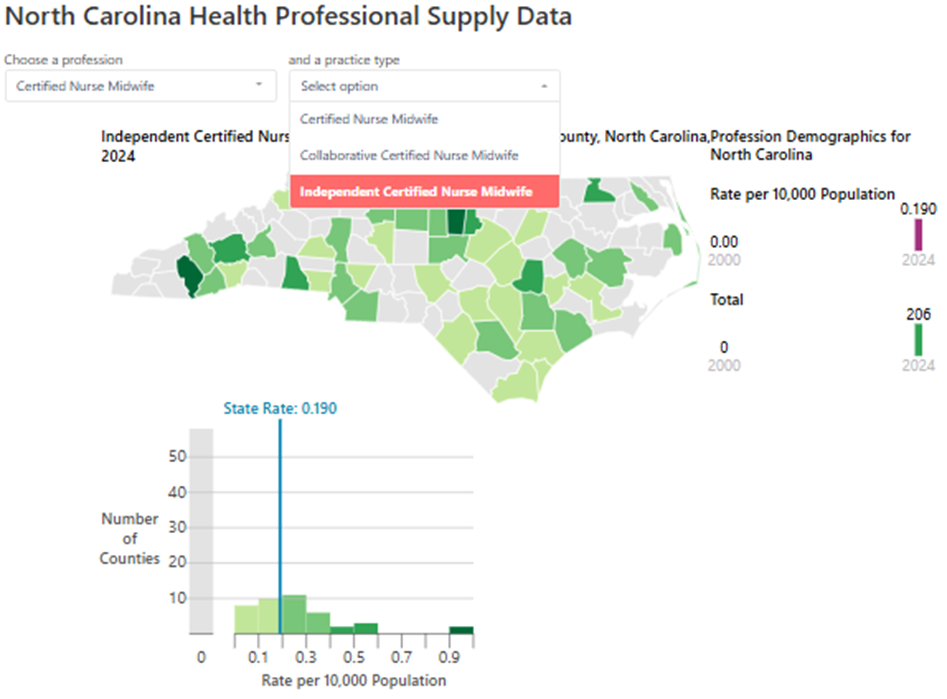
Note. Data include active certified nurse midwives in practice in North Carolina as of October 31 of each year. Data are derived from the North Carolina State Board of Nursing. Population census data and estimates are downloaded from the North Carolina Office of State Budget and Management via NC LINC and are based on US Census data.
About the HPDS
The North Carolina Health Professions Data System (HPDS) represents a longstanding collaborative relationship between Sheps Health Workforce NC and North Carolina licensure boards, dating back to 1979. With funding from NC Area Health Education Center (AHEC), the Sheps Health Workforce team manages the HPDS by collecting, cleaning, analyzing, and disseminating annual licensure data on demographic, practice, and geographic characteristics of 21 NC health professions from 11 state licensure boards.
Suggested Citation
Joshi A, Moore C, Lombardi BN. 2024 Health Workforce Update: Insights from the North Carolina Health Professions Data System. Research Blog Post. September 16 2025. Sheps Health Workforce NC. Program on Health Workforce Research and Policy. Cecil G. Sheps Center for Health Services Research. UNC Chapel Hill.