2023 Data Update: The North Carolina Health Professions Data System
By Connor Sullivan, Catherine Moore
Oct 4, 2024
The North Carolina Health Professions Data System (HPDS) represents a longstanding collaborative relationship between Sheps Health Workforce NC and North Carolina (NC) licensure boards, dating back to 1979.
With funding from NC AHEC, the HPDS team collects, cleans, analyzes, and disseminates annual licensure data on demographic, practice, and geographic characteristics of 21 NC health professions.
The NC Health Supply Data Dashboard has recently been updated with 2023 data.
Select findings from 2023 review:
-
The physician workforce increased 22% (from 22,414 to 27,410) between 2013 and 2023, while the NC population grew 10.6% (from 9,804,787 to 10,842,949). Taken together, the ratio of physicians to NC population grew from 22.9 per 10,000 population (10k) to 25.3 per 10k.
-
Specialties with the top percentage growth between 2013 and 2023 include Hospitalist, Neurology, Infectious Disease, Physical Medicine Rehabilitation, and Emergency Medicine (Figure 2).
-
The hospitalist workforce experienced the greatest percentage growth during the period, increasing 98.6% (from 759 to 1,507). The ratio of hospitalists to NC population grew from 0.8 to 1.4 per 10k.
-
Neurology, Infectious Disease, Physical Medicine Rehabilitation, and Emergency Medicine specialties all grew approximately 50% (range 46.4%-51.6%):
-
Neurology increased 51.6% (from 378 to 573). The ratio of neurologists to NC population increased from 0.4 to 0.5 per 10k.
-
The infectious disease physician workforce increased 49.7% (from 175 to 262). The ratio of infectious disease physicians to NC population experienced a small increase, from 0.18 to 0.24 per 10k.
-
The physical medicine rehabilitation workforce increased 49.2% (from 118 to 176). The ratio of physical medicine rehabilitation physicians to NC population experienced a small increase, from 0.12 to 0.16 per 10K.
-
The emergency medicine workforce increased 46.4% (from 1,113 to 1,629). The ratio of emergency medicine physicians to NC population grew from 1.1 to 1.5 per 10k.
-
-
Figure 1. North Carolina Physician Specialties with the Greatest Percentage Growth, 2013-2023
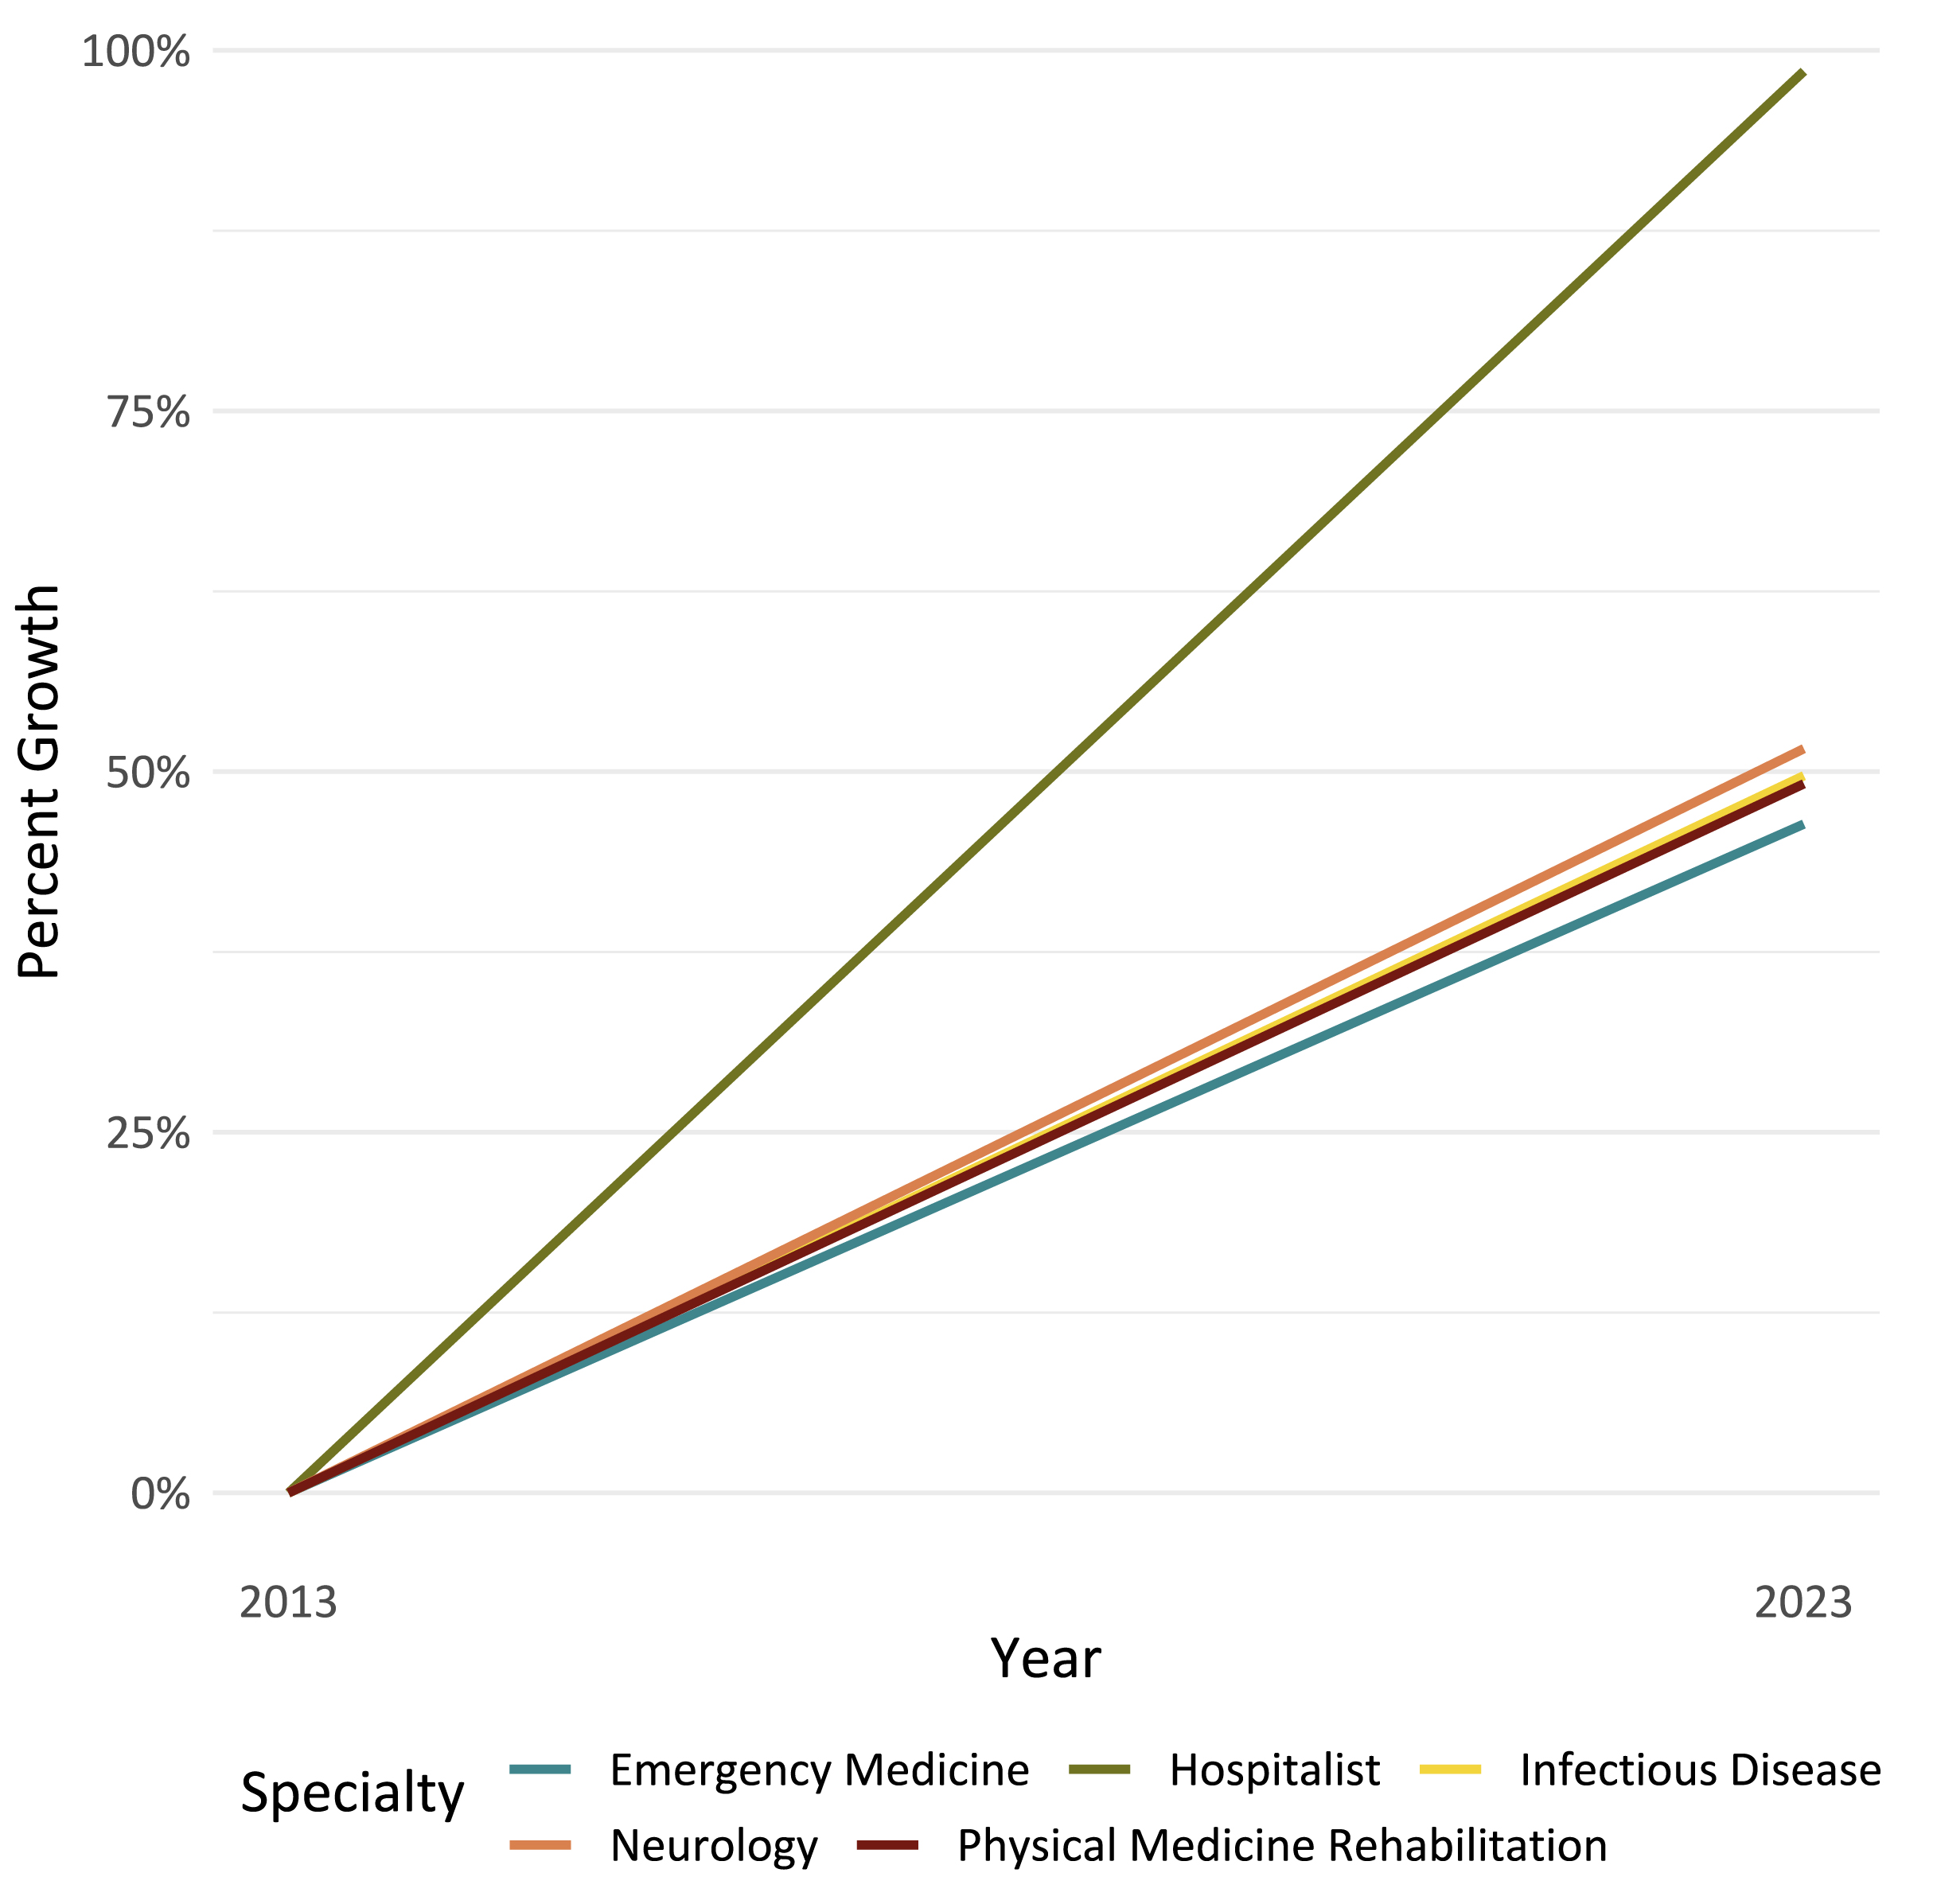
Note: Data are visualized as a continuous line from 2013 to 2023, while natural fluctuations occur in the data.
- The LPN workforce underwent a steady decrease in the rate of LPNs per 10K population since 2000: decreasing from 21.7 LPNs per 10K population in 2000 to 16.0 LPNs per 10K population in 2023. The total number of active LPNs in NC decreased each year between 2019-2021(a loss of approximately 1,500 LPNs during the period), but growth resumed in 2023 to 17,362 active LPNs (Figure 2).
Figure 2. North Carolina Licensed Practical Nurses, 2000-2023

Note: Licensed practical nurse (LPN).
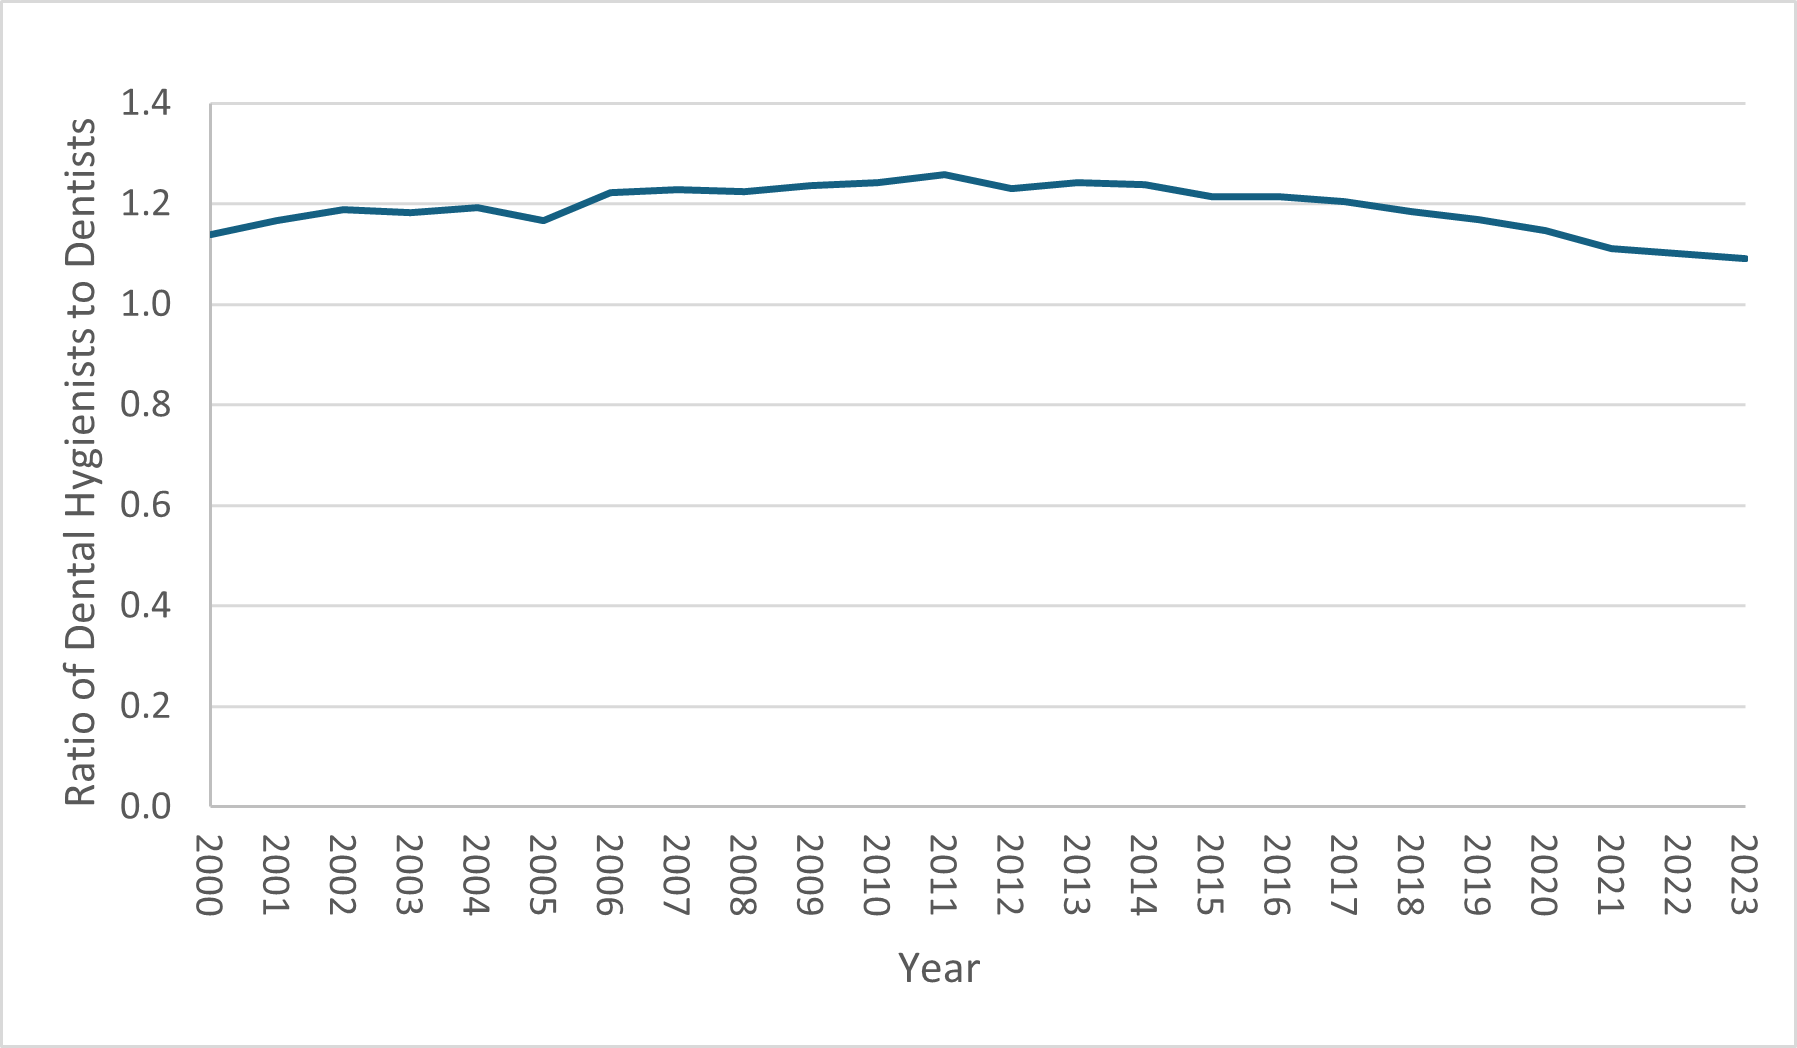
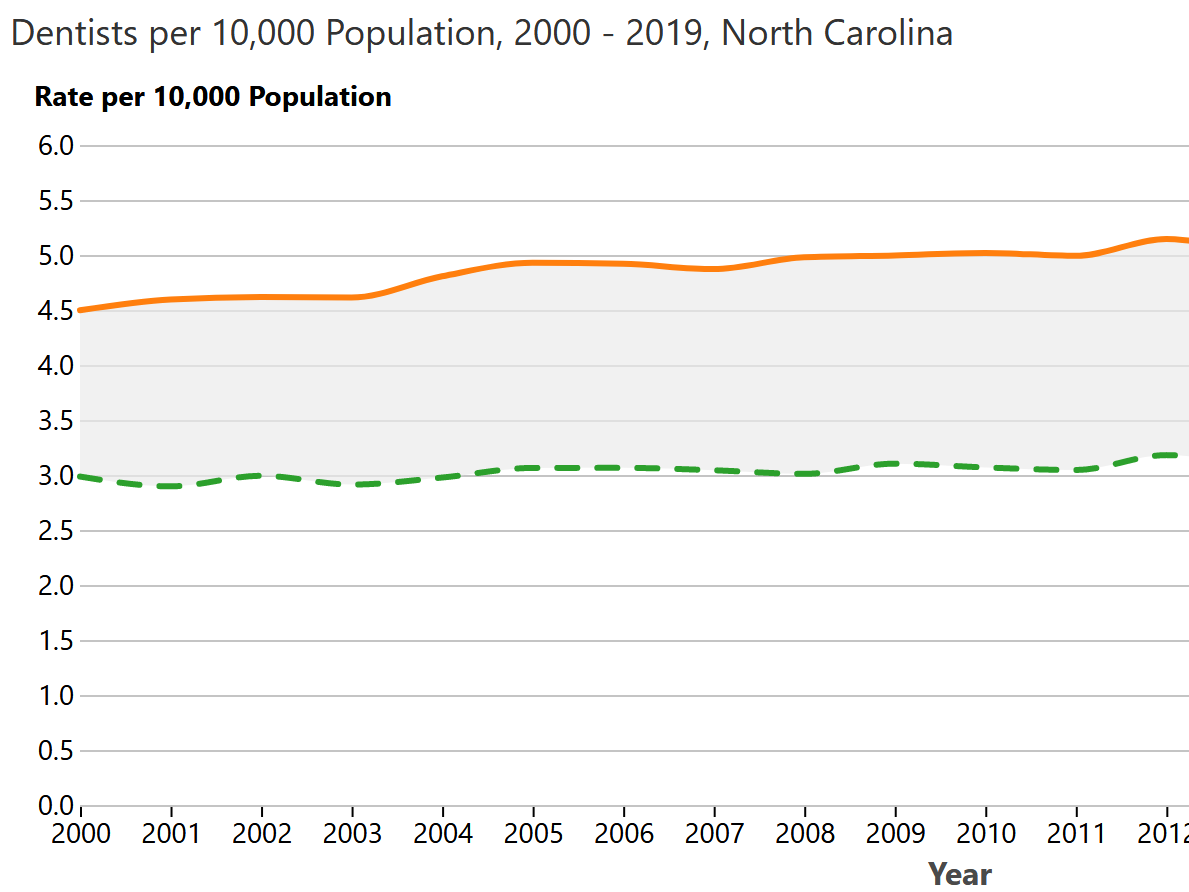
- The ratio of dental hygienists (n = 6,631) to dentists (n = 6,075) in NC has decreased steadily since its peak of 1.26 dental hygienists to dentists in 2011, with a ratio of 1.09 dental hygienists to dentists noted in 2023. (Figure 3).
Figure 3. Ratio of Active North Carolina Dental Hygienists to Active Dentists, 2000-2023