Is Access to Primary Care Clinicians Improving In North Carolina?
By Evan Galloway
Nov 4, 2024
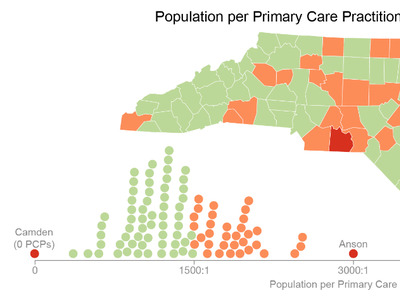
Sheps Health Workforce NC has produced a primary care clinician index since 2017 to measure geographic access to primary care. The primary care clinician index is a ratio of population to primary care clinicians, so a ratio with a higher value suggests lower access to primary care services. We include physicians, nurse practitioners, physician assistants, and certified nurse midwives as primary care clinicians. (Details on the methodology for the index are provided below.) Guided by the recommendations of a federal report, we selected a ratio of 1,500 people to 1 primary care clinician or fewer as the standard of whether a county has sufficient primary care clinicians to meet population health needs. However, even in areas that fall below the 1,500:1 threshold, individuals may experience difficulty in obtaining primary care services, as a result of socioeconomic factors, lack of insurance, and other barriers. This blog analyzes changes in the index between 2017 and 2023.
Overall, the ratio for the state improved from 983:1 in 2017 to 808:1 in 2023. Among the 100 counties in North Carolina in 2023, 76 were below a 1,500:1 population to provider ratio, an improvement from 2017 when only 64 met that standard. Counties above the 1500:1 ratio would need approximately 174 primary care clinician FTEs to bring them under the threshold for primary care sufficiency.
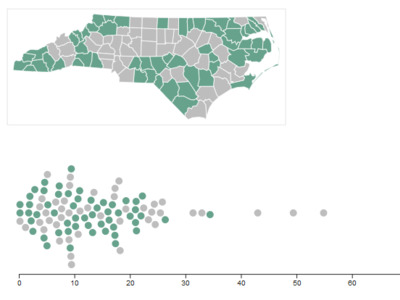
Figure 1 below shows the percentage change in the index between 2017 and 2023. Blue indicates that the number of people per primary care clinician decreased. For instance, Wake County is light blue because the county’s primary care clinician index decreased by 21% between 2017 and 2023, suggesting improved access to care.
Figure 1: Percentage Change in the Primary Care Clinician Index by County, North Carolina, 2017-2023

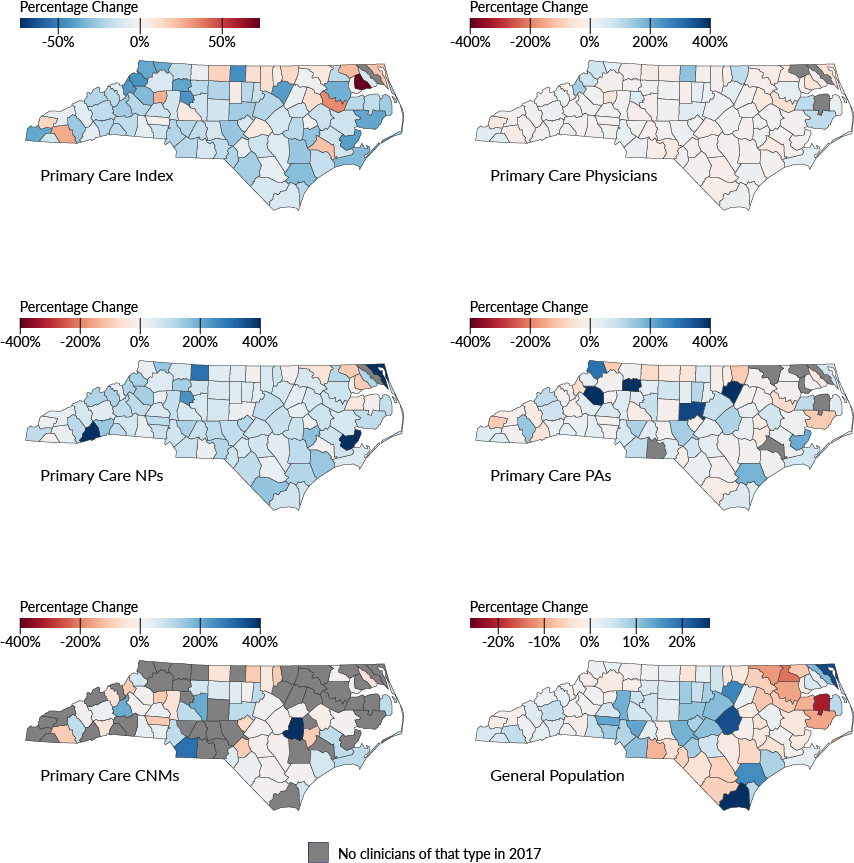
These findings suggest an overall improvement in the primary clinician index in NC despite rapid population growth. In other words, the growth of primary care clinicians has matched the population growth. However, there is variation between counties, and it is important to assess the source of these differences. The primary care clinician index is made up of multiple components with population change in the numerator and changes in the numbers of different types of primary care clinicians in the denominator. The maps below analyze each of these components of change at the county level with blue indicating a percentage growth in the component and red representing a decrease. Figure 2 illustrates that, for example, Brunswick and Johnston counties have experienced rapid population growth, but an even larger increase in the supply of nurse practitioners, physycian assistants, and primary care physicians has meant that the index for those counties has improved.
Figure 2: Percentage Change in the Components of the Primary Care Clinician Index by County, North Carolina, 2017-2023
Notes: Primary care physicians, physician assistants, and nurse practitioners are defined as in Spero JC & Galloway EM. (2019) Running the Numbers. North Carolina Medical Journal, 80(3), 186-190. Physicians with a primary area of practice of obstetrics/gynecology were weighted as 0.25 of a full-time equivalent (FTE) primary care clinician. All other primary care physicians were weighted as 1 FTE. Primary care physician assistants, nurse practitioners, and certified nurse midwives were weighted as 0.75 FTE. Physician and physician assistant data are derived from licensure data provided by the North Carolina Medical Board. This analysis only includes physicians who are not residents-in-training and are not employed by the Federal government. Nurse practitioner and certified nurse midwife data is derived from licensure data provided by the North Carolina Board of Nursing. Data include active, licensed clinicians in practice in North Carolina as of October 31 of each year. Clinicians are assigned to counties based on primary practice location. County populations were adjusted for age and gender according to primary care use rates described in data from the Medical Expenditure Panel Survey. The raw (unadjusted) population data was from the NC Office of State Budget and Management. The methods are substantially the same as and are described in more detail in this paper: Zolotor AJ, Galloway E, Beal M & Fraher EP. (2022) Primary Care Clinicians in Low-Access Counties. North Carolina Medical Journal, 83(3), 163–68.


