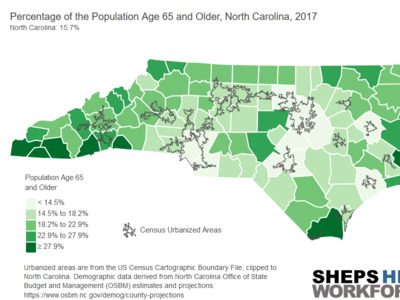
Which North Carolina counties have older populations?

By Evan Galloway, Julie Spero

Jan 28, 2019

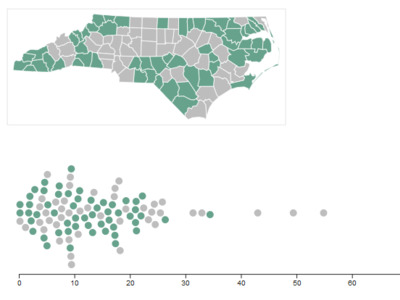
Use the slider bar below the map to scroll through years 2000 to 2037 and see the changes by county.
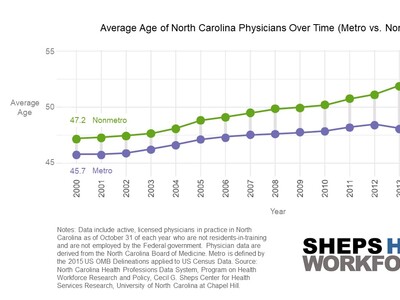
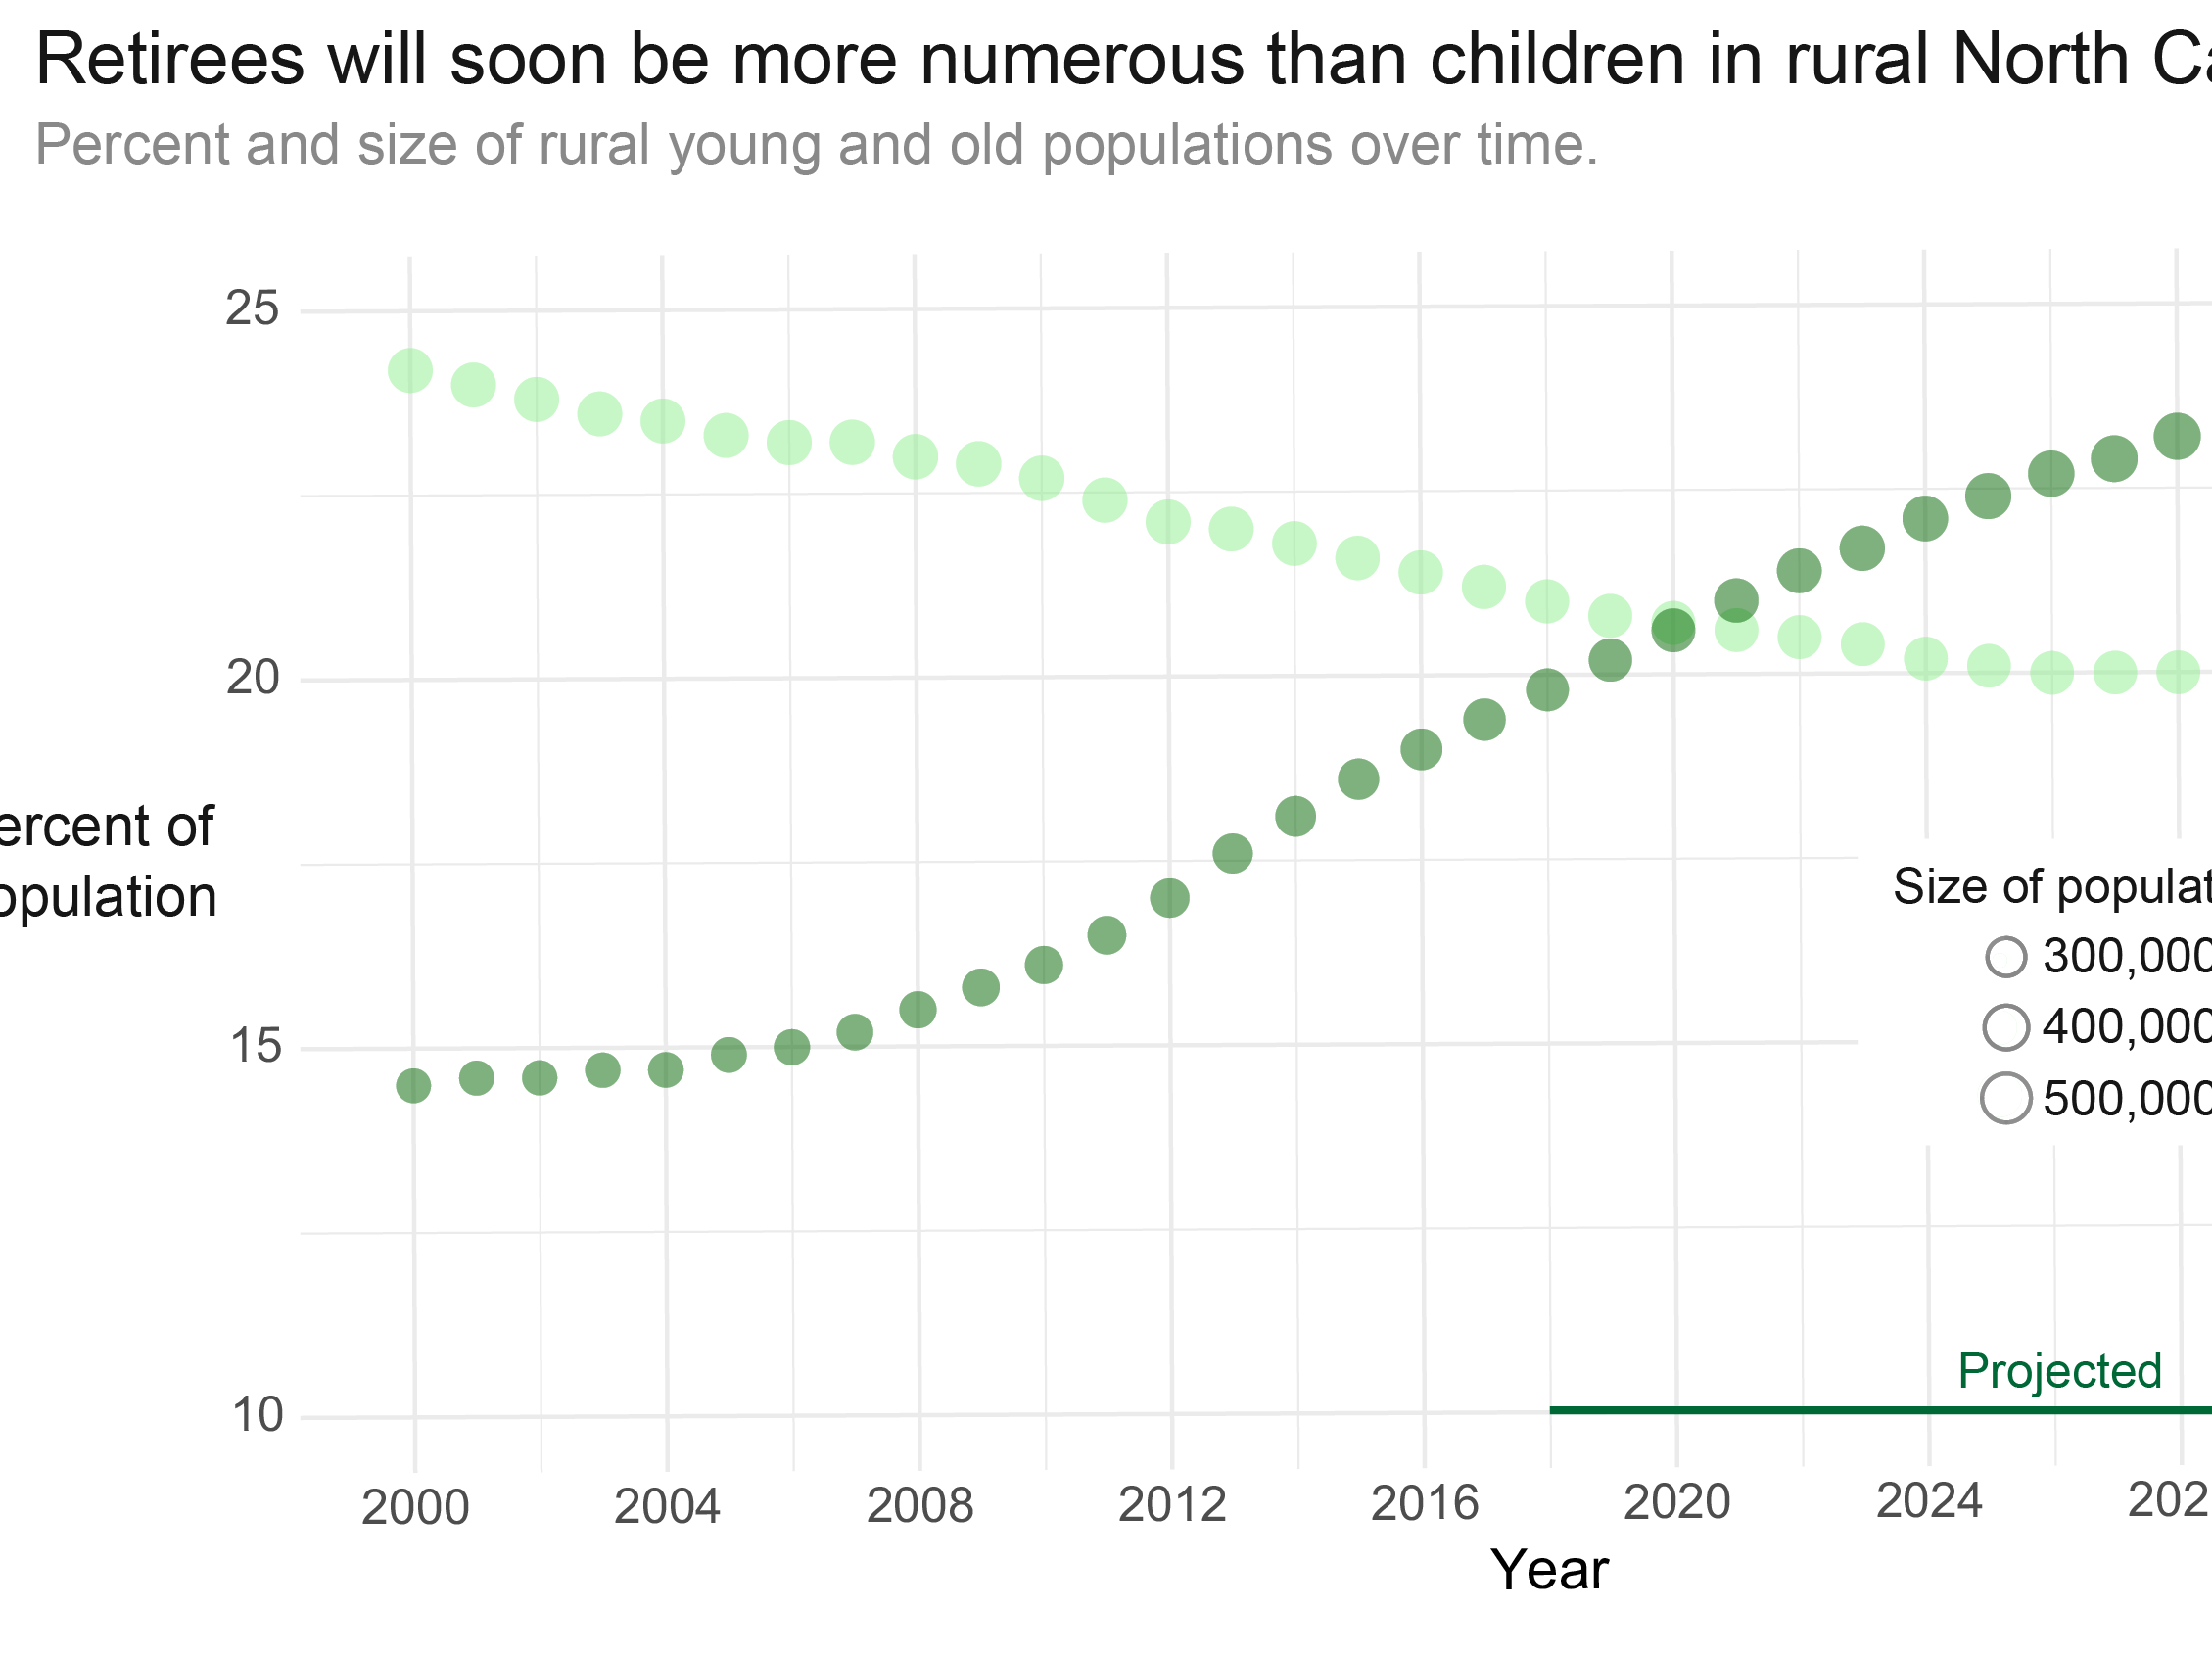
Percentage of the Population Age 65 and Older, North Carolina, 2018North Carolina: 16%Urbanized areas are from the US Census Cartographic Boundary File, clipped toNorth Carolina. Demographic data derived from North Carolina Office of StateBudget and Management (OSBM) estimates and projections:https://www.osbm.nc.gov/demog/county-projectionsPopulation Age 65 and Older< 10%10% to 17%17% to 24%24% to 30%≥ 30%Census Urbanized Areas
Year
2018
Year of Population Data
Funding & Acknowledgements
The HPDS is maintained by the Program on Health Workforce Research and Policy at the Cecil G. Sheps Center for Health Services Research at the University of North Carolina at Chapel Hill, in collaboration with the North Carolina Area Health Education Centers Program (AHEC), and the state’s independent health professional licensing boards. Ongoing financial support is provided by the NC AHEC Program Office. Although the NC HPDS maintains the data system, the data remain the property of their respective licensing board. This information or content and conclusions are those of the authors and should not be construed as the official position or policy of, nor should any endorsements be inferred by NC AHEC. To learn more about NC AHEC please visit: https://www.ncahec.net.

Recent Posts