North Carolina Psychologists by Age and Sex
By Evan Galloway
Feb 26, 2019
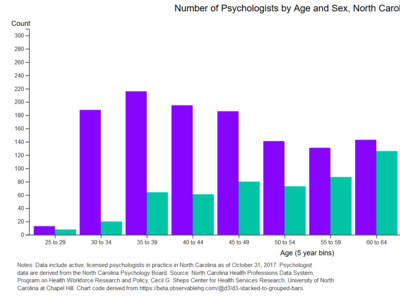
- Nearly a quarter of psychologists are 65 or older (compare this to physicians where only ~12% are 65 or older).
- 60% of the psychologists who are 65 or older are male, but 70% of those younger than 65 are female.
- New entrants to the profession are predominantly women. Four out of five psychologists who are 45 or younger are female.