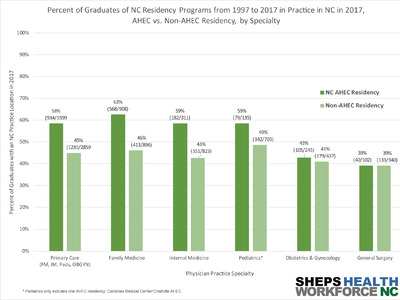
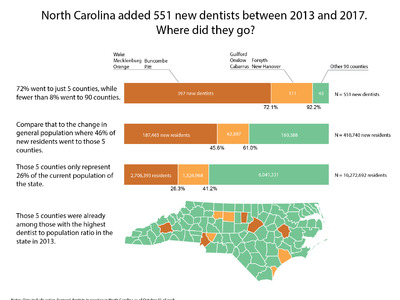
How has RN Retention in North Carolina Changed over Time?
By Caroline Spencer, Abhi Joshi, Evan Galloway, Catherine Moore, Erin Fraher
Apr 14, 2025
North Carolina (NC) is projected to face a shortage of approximately 12,500 registered nurses (RNs) in 2033 (NC Nursecast). Addressing this shortage requires a multi-tiered approach that includes strategies to increase the number of graduates from RN programs in the state, retaining existing RNs in the workforce, and reengaging RNs who have exited the workforce. This brief summarizes findings from an analysis of nurse retention and exit from the NC workforce between 2016 and 2023. These data will be helpful to policy makers to understand whether nursing workforce retention rates have changed over time and the degree to which a “reserve labor pool” of nurses exists who might be incentivized to return to practice after exiting the workforce.
This study draws on annual licensure data from 2016-2023 collected by the North Carolina Board of Nursing (NCBON) and housed at the NC Health Professions Data System (HPDS) at the Cecil G. Sheps Center for Health Services Research. These deidentified, annual longitudinal data can be linked over time to track the workforce behaviors of individual RNs.
Registered nurses renew their licenses every two years in NC and each time they renew, it is possible to examine whether they were retained in the active workforce or if they exited practice. Each year, new nurses enter the workforce (initial licensees), and these new entrants are added to the existing workforce that is already licensed and in active practice in the state in that year. Based on this two-year cycle of data renewal, we created six analysis cohorts from 2016 through 2021. Each cohort is comprised of RNs who were issued their initial RN license in that year plus those who renewed their license and were in active practice that year. We examined the percentage of each cohort that was retained in active practice or had exited the workforce two years later. Nurses who exit practice are defined in this analysis as RNs who had an inactive NC nursing license two years later, those who renewed the license but were no longer in active nursing practice, or those who renewed but were not practicing in NC two years later. Figure 1 summarizes this methodology for the 2016 cohort which was then repeated for the 2017-2021 cohorts. After analyzing each cohort separately, we then pooled the cohorts and analyzed RN retention by level of “workforce engagement” in the starting year. Workforce engagement was defined as the nurse’s employment status as full-time, part-time, per diem, volunteer, or unemployed/seeking employment in nursing in the initial year of the cohort.
Figure 1. Example of Retention Analysis for 2016 Cohort.
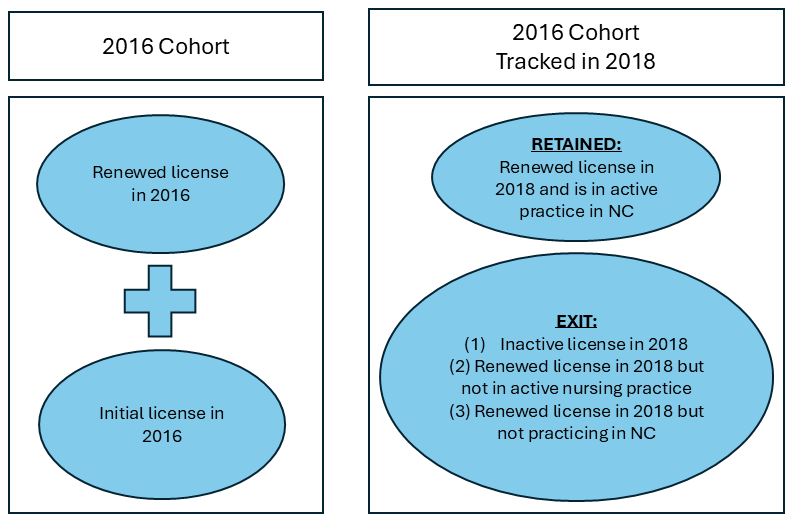
Table 1. RN Retention and Exit for the 2016-2021 Cohorts.
| Year of Licensure Data | Number of RNs Who Renewed or Were Initially Licensed | Number of RNs in Active Practice 2 Years Later | Number of RNs in Inactive Practice Two Years Later | Percent RNs Retained in Active Practice Two Years Later | Percent RNs Who Exited Active Practice Two Years Later |
|---|---|---|---|---|---|
| 2016 | 46,253 | 41,056 | 5,197 | 88.8% | 11.2% |
| 2017 | 48,961 | 42,139 | 6,822 | 86.1% | 13.9% |
| 2018 (data unavailable) | |||||
| 2019 | 51,397 | 43,265 | 8,132 | 84.2% | 15.8% |
| 2020 | 50,529 | 43,288 | 7,241 | 85.7% | 14.3% |
| 2021 | 52,461 | 44,521 | 7,940 | 84.9% | 15.1% |
Note. Registered nurse (RN). Registered nurse licenses are renewed every two years. Each analysis cohort described in Table 1 represents the combined count of active nurse licenses that were initiated or renewed in a given year. For example, the total number of active RN licensees practicing in North Carolina in 2016 was 101,570. Of this number, 46,253 licenses were either newly issued or renewed in 2016, which is the value reflected in the table. Licensure data for the 2018 cohort had a higher percentage of nurses with missing data compared to other years and were removed from the analysis in Table 1, Figure 2, and Figure 3.
The percentage of RNs who exited the NC workforce increased from 13.9% in 2019 (two years after 2017 renewals) to 15.1% in 2023 (two years after 2021 renewals). The rate of exit was greatest for the 2019 analysis cohort at 15.8% when tracked two years later in 2021. This increase in exits could be partially explained by the fact that the 2019 cohort was tracked in 2021, which was during the COVID 19 pandemic. The exit rate decreased from this high point in subsequent years. However, as noted in Figure 2, the exit rate remains higher than the pre-pandemic exit rate.
Figure 2. North Carolina RN Workforce Exit Rate, 2019-2023.
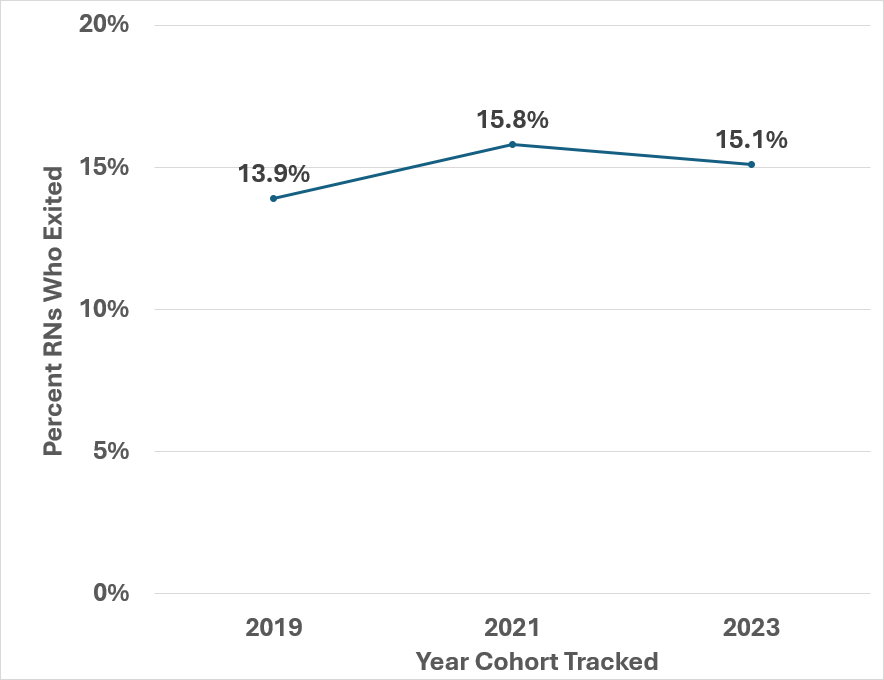
Note. Registered nurse (RN). Data represents RN Cohorts from 2017, 2019, and 2021 who were tracked two years later to determine RN exit rate for each cohort. Licensure data for the 2018 cohort had a higher percentage of nurses with missing data compared to other years and were removed from the analysis in Table 1, Figure 2, and Figure 3.
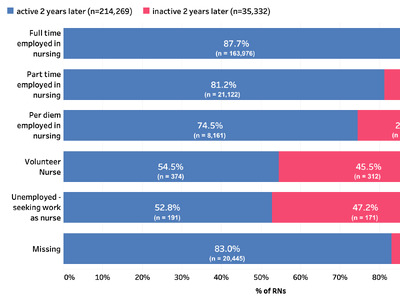
Figure 3 represents the combined data across all cohorts. One notable area that differed between RNs who were retained in the workforce versus those who exited was level of engagement in the workforce in the initial year of the cohort.
Figure 3. RN Retention in the Workforce by Level of Workforce Engagement.
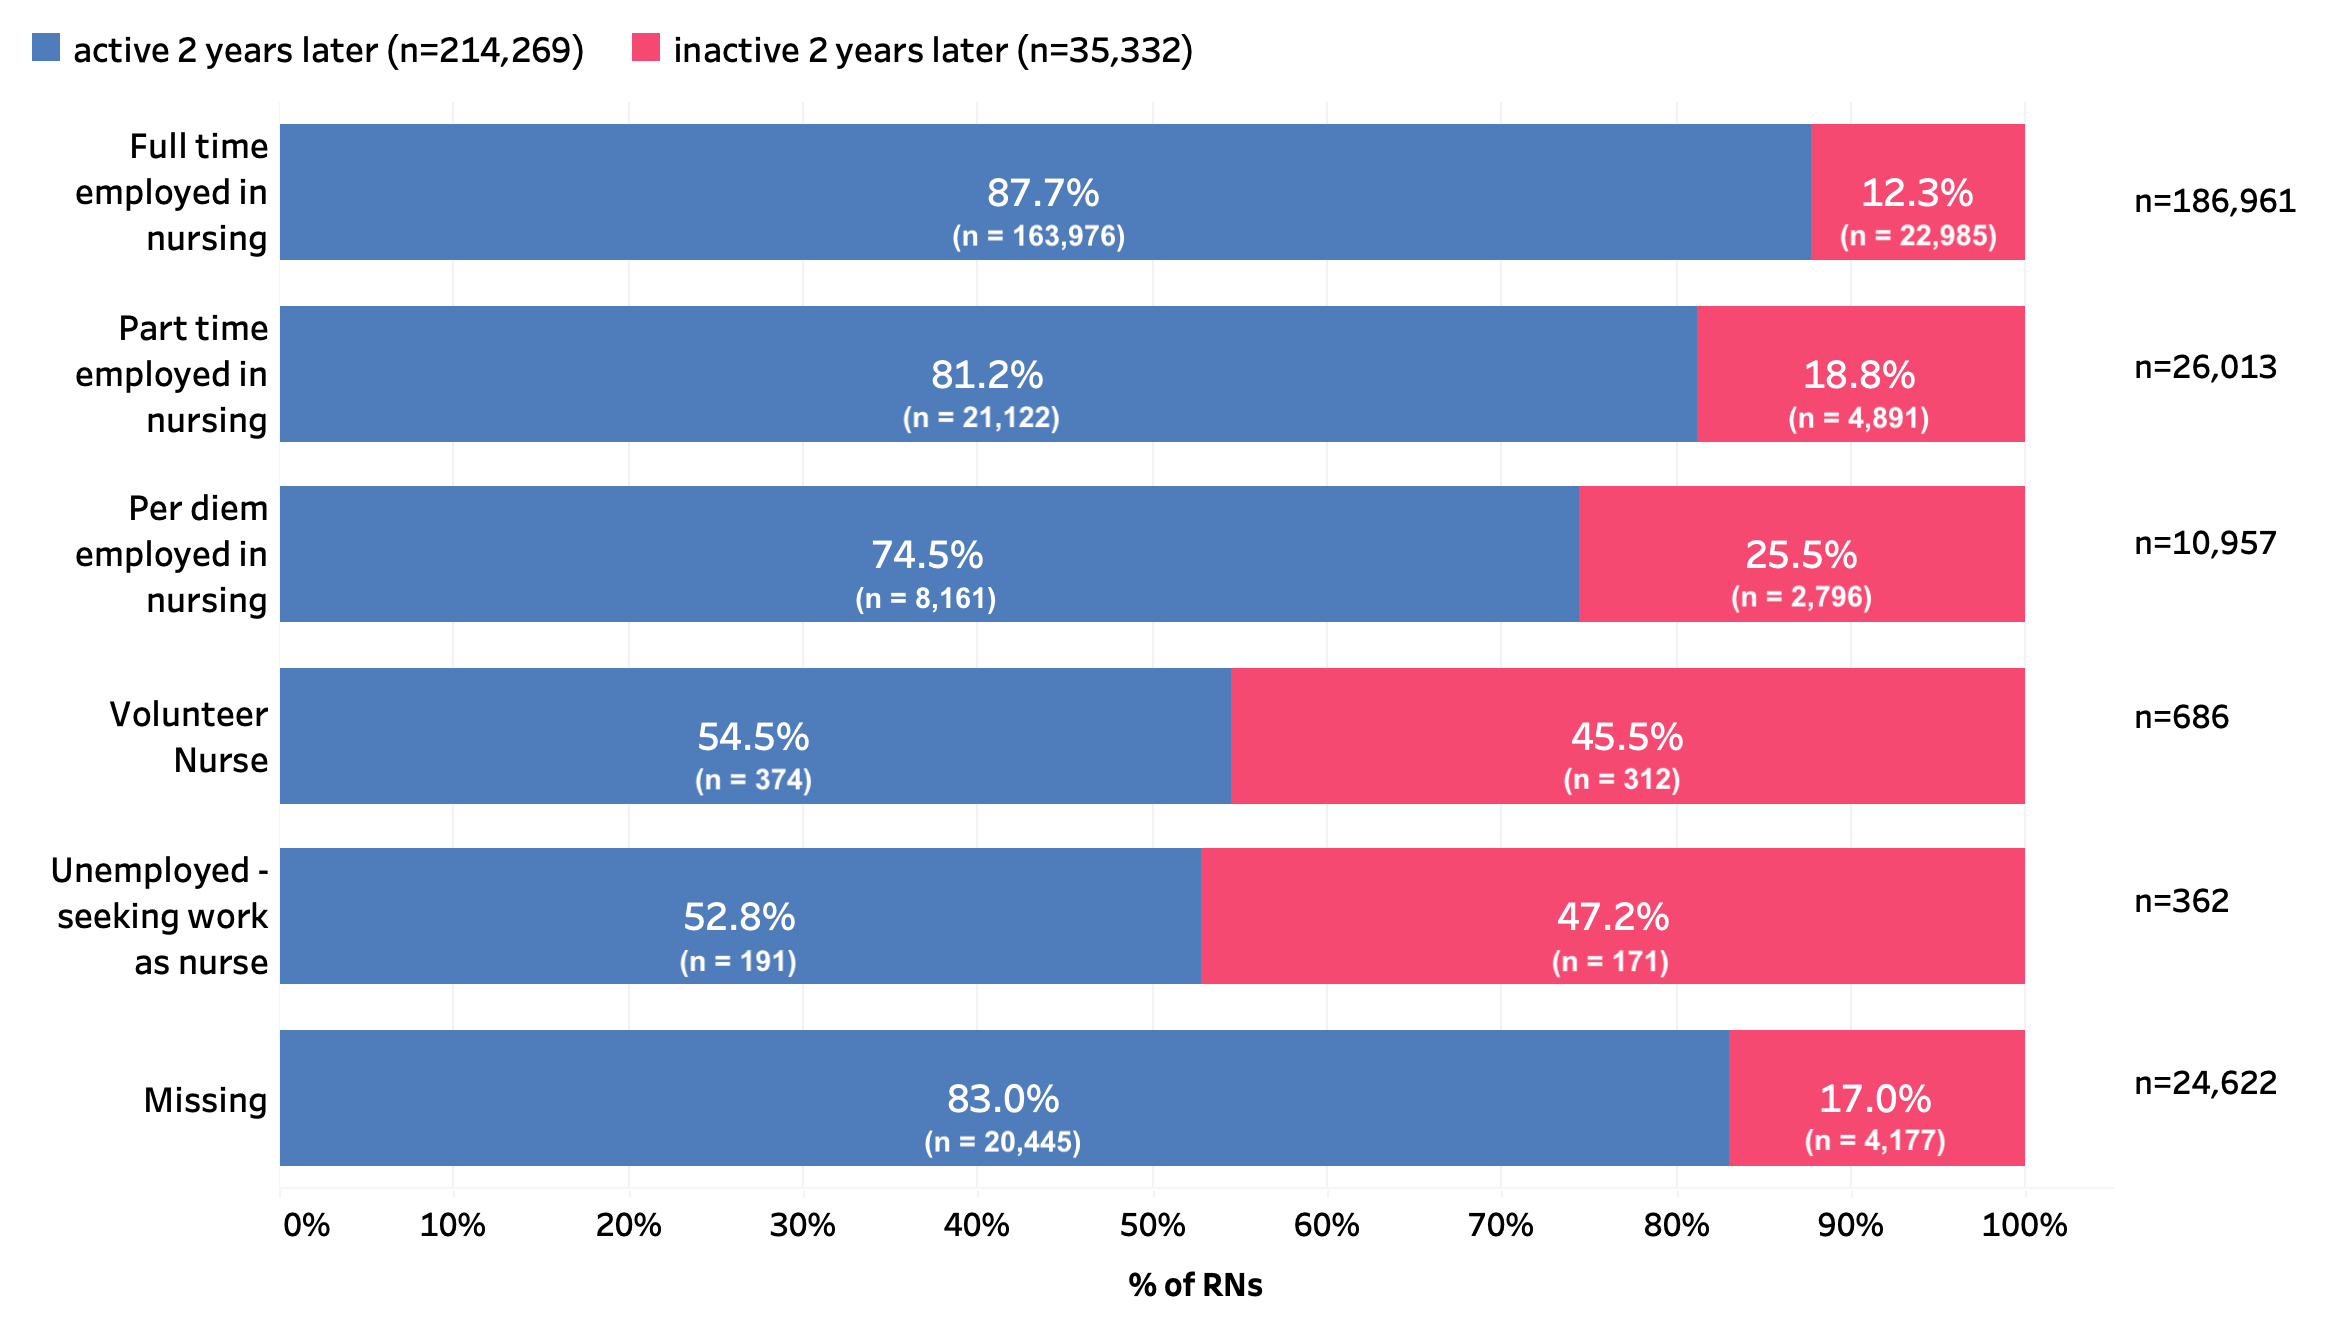
Note. Registered nurse (RN). Figure represents five cohorts combined 2016-2021, excluding the 2018 cohort. Licensure data for the 2018 cohort had a higher percentage of nurses with missing data compared to other years and were removed from the analysis in Table 1, Figure 2, and Figure 3. Missing values for employment status were evenly distributed among cohorts included in analysis. Unemployed – seeking work as nurse was not included as a category for employment status until 2019.
The percentage of RNs retained in the workforce after two years was lower for nurses engaged in working part time, per diem, volunteer status, or unemployed and seeking work as an RN compared to those who worked full-time (p <0.0001). As noted in Figure 2, full- time RNs were retained at a rate of 87.7%. Part-time RNs were retained at a rate of 81.2%. Per diem RNs were retained at a rate of 74.5%. Volunteer RNs were retained at a rate of 54.5 % and unemployed RNs seeking RN employment were retained at a rate of 52.8%. Unemployed RNs seeking work as a nurse were included in the active workforce because they make up an available portion of the RN workforce.
The 2024 NC Institute of Medicine Task Force on the Nursing Workforce report includes recommendations for strengthening the NC nursing workforce. Additionally, an ongoing collaboration between Sheps and NC AHEC includes a project to identify evidence-based practices to retain and reengage RNs. The work will include further analyses of data on characteristics of RNs who exit and reenter the workforce. These findings will be reported in a future blog and will help to inform policy discussions for interventions to increase retention and reengagement of RNs in the NC workforce.