North Carolina Social Work Data Snapshot 2024
Mar 25, 2026
Licensed Clinical Social Workers & Associates
Supply
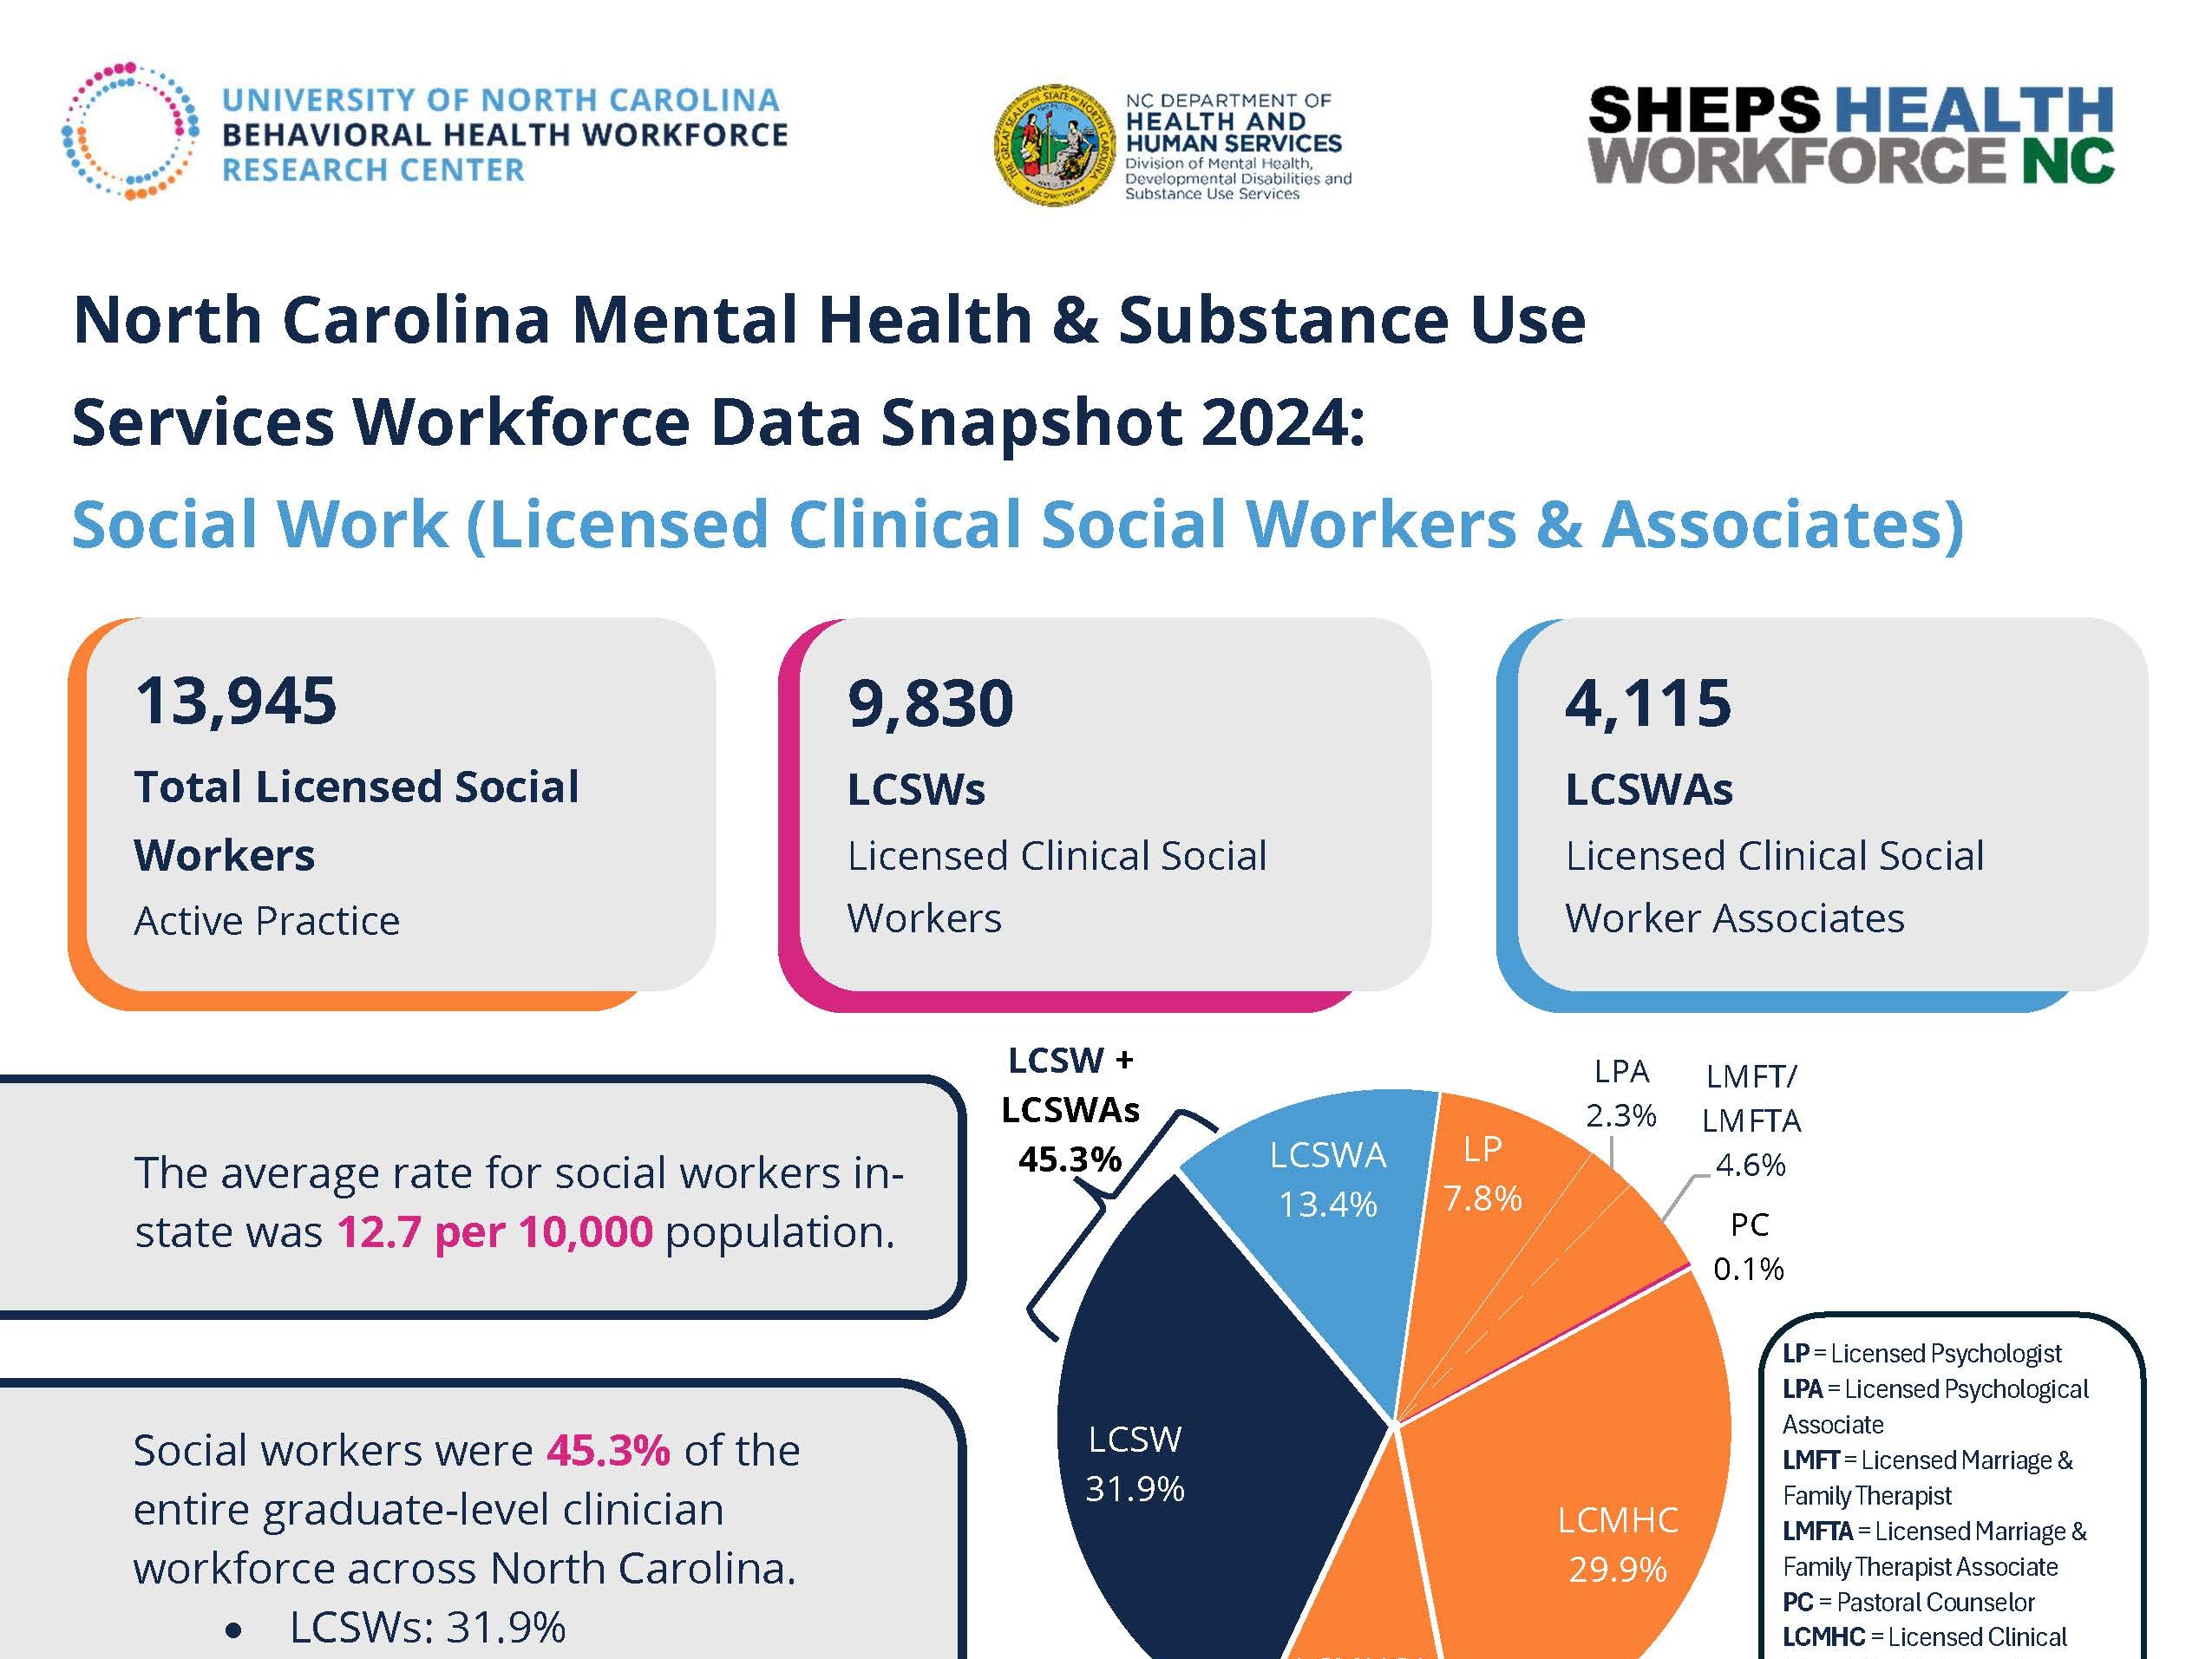
13,945
Total Licensed Social Workers
Active practice
9,830
LCSWs
Licensed Clinical Social Workers
4,115
LCSWAs
Licensed Clinical Social Worker Associates
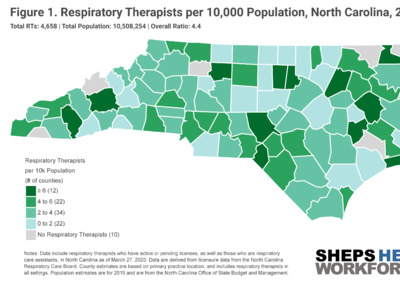
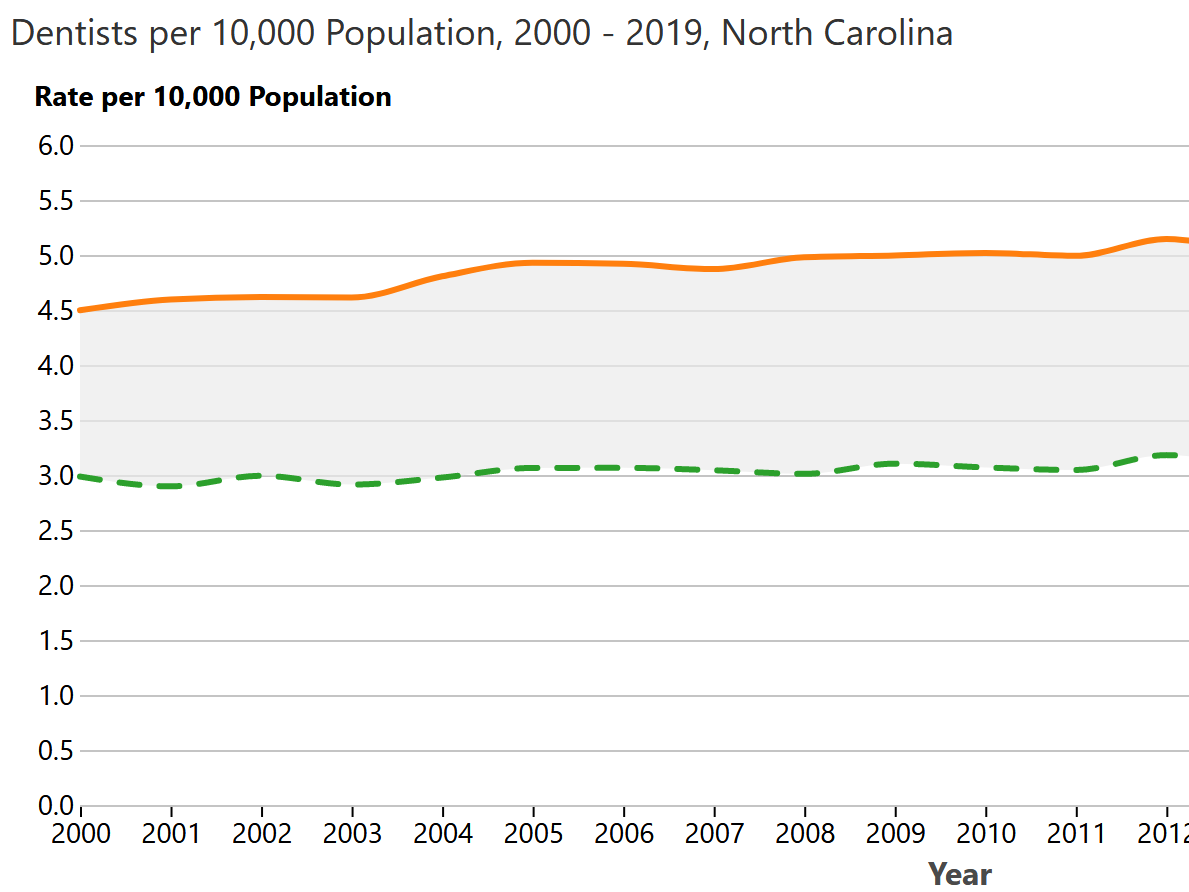
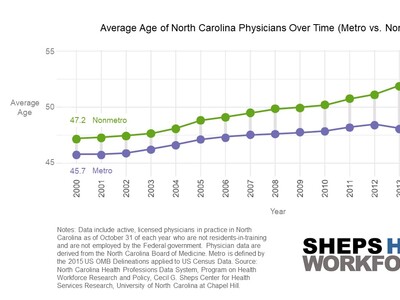
The average rate for social workers in-state was 12.7 per 10,000 population.
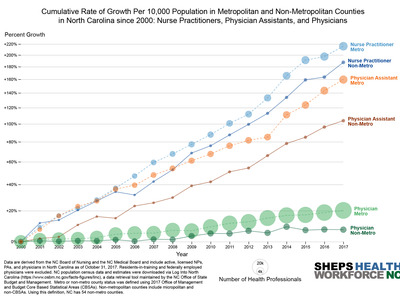
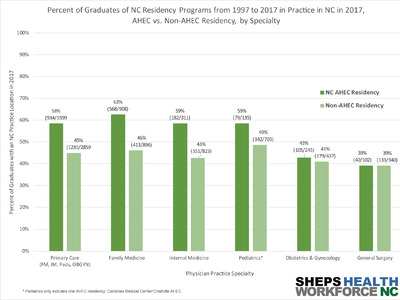
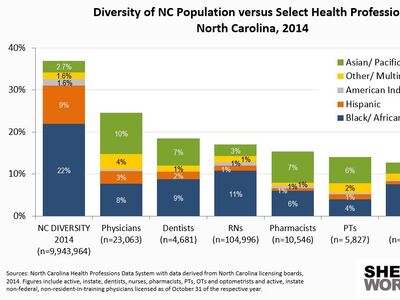
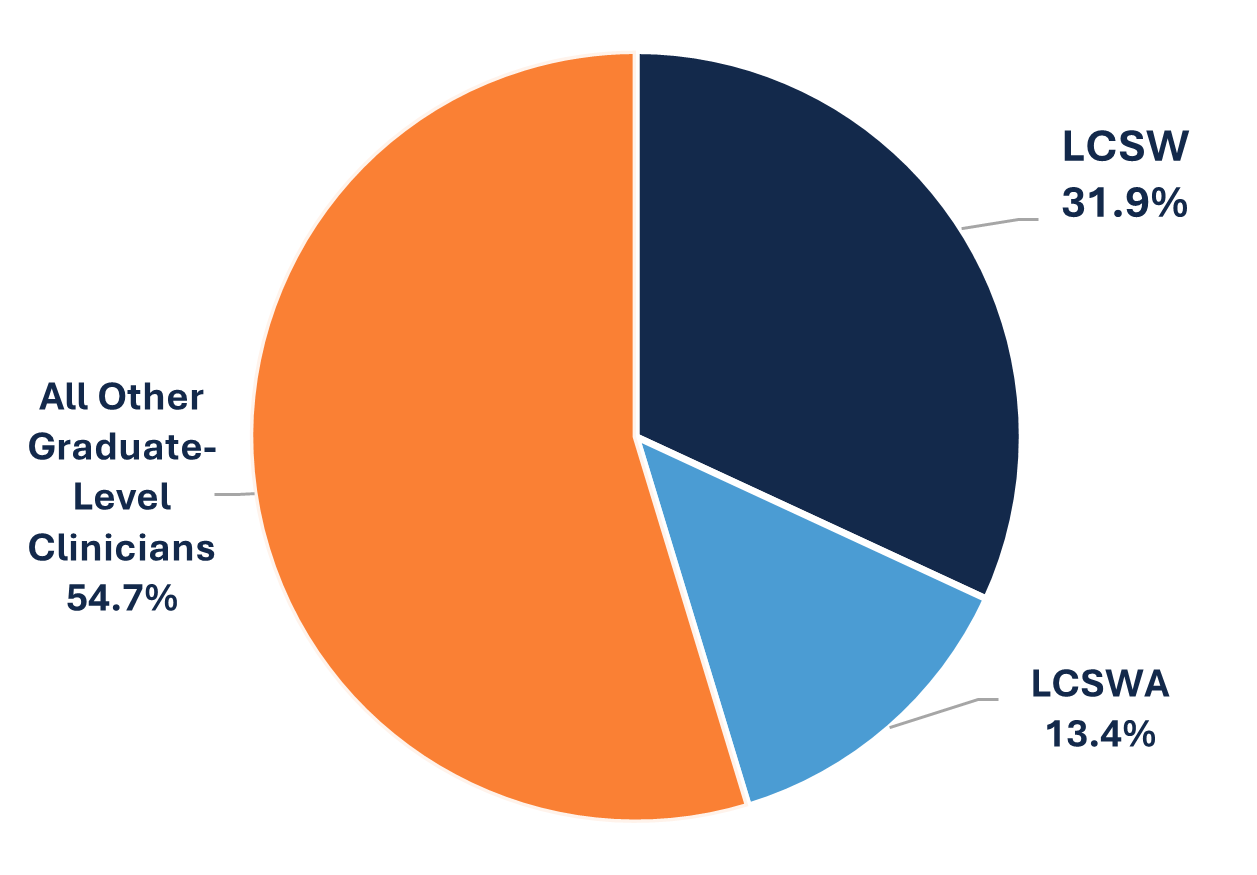
Social workers were 45.3% of the entire graduate‑level clinician workforce across North Carolina.
- LCSW: 31.9%
- LCSWA: 13.4%
North Carolina Graduate-level Clinician Workforce by Profession Type, 2024
Distribution
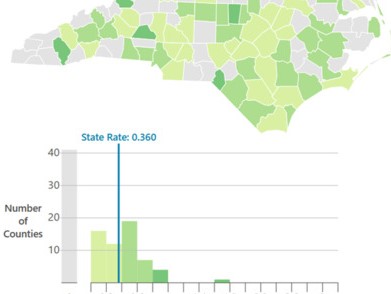
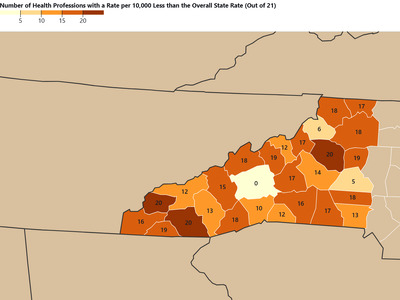
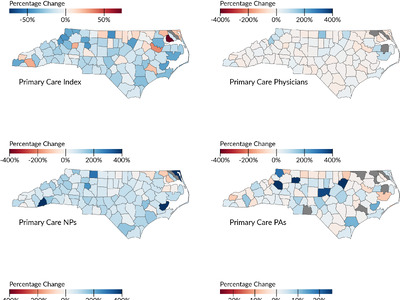
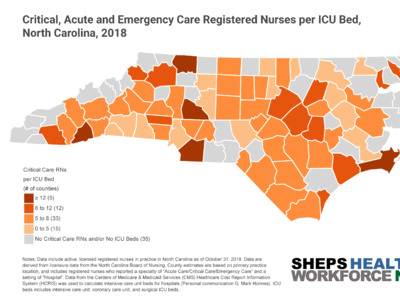
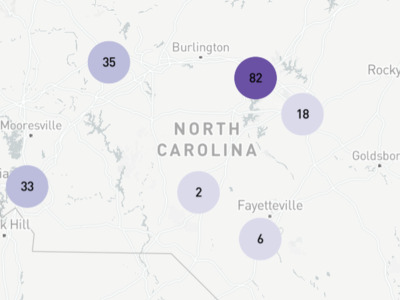
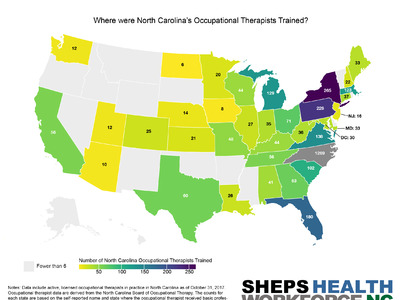
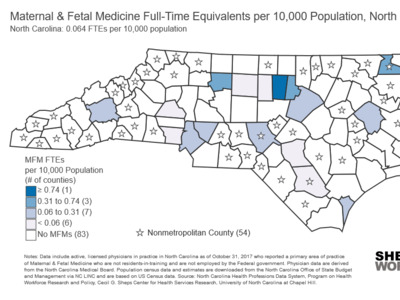
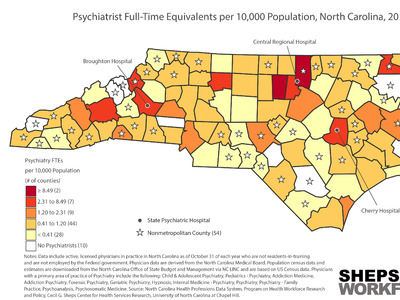
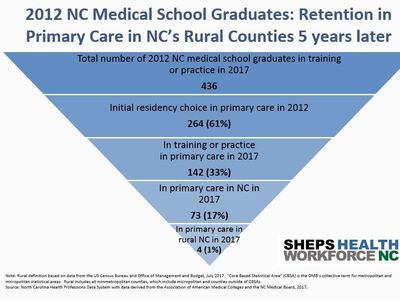
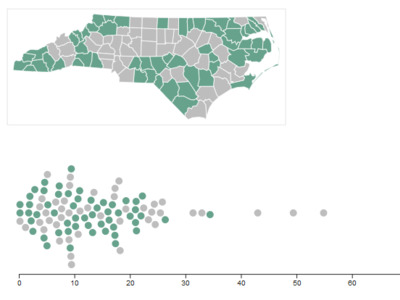
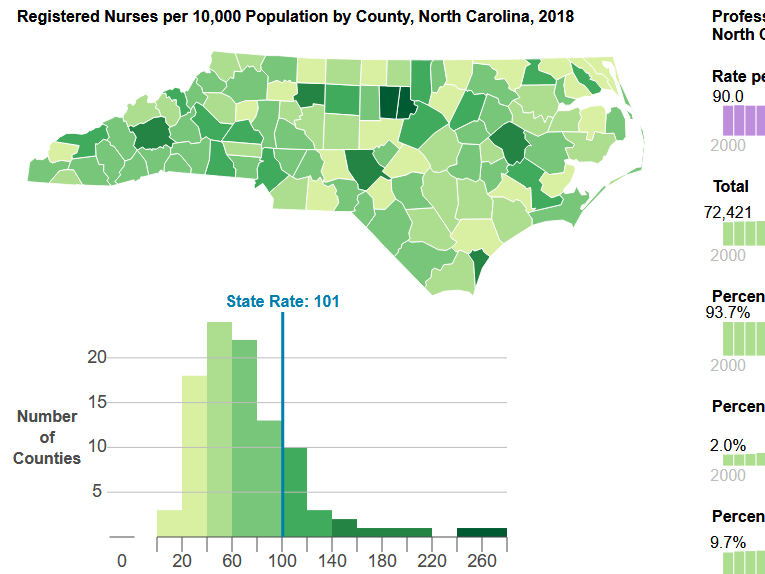
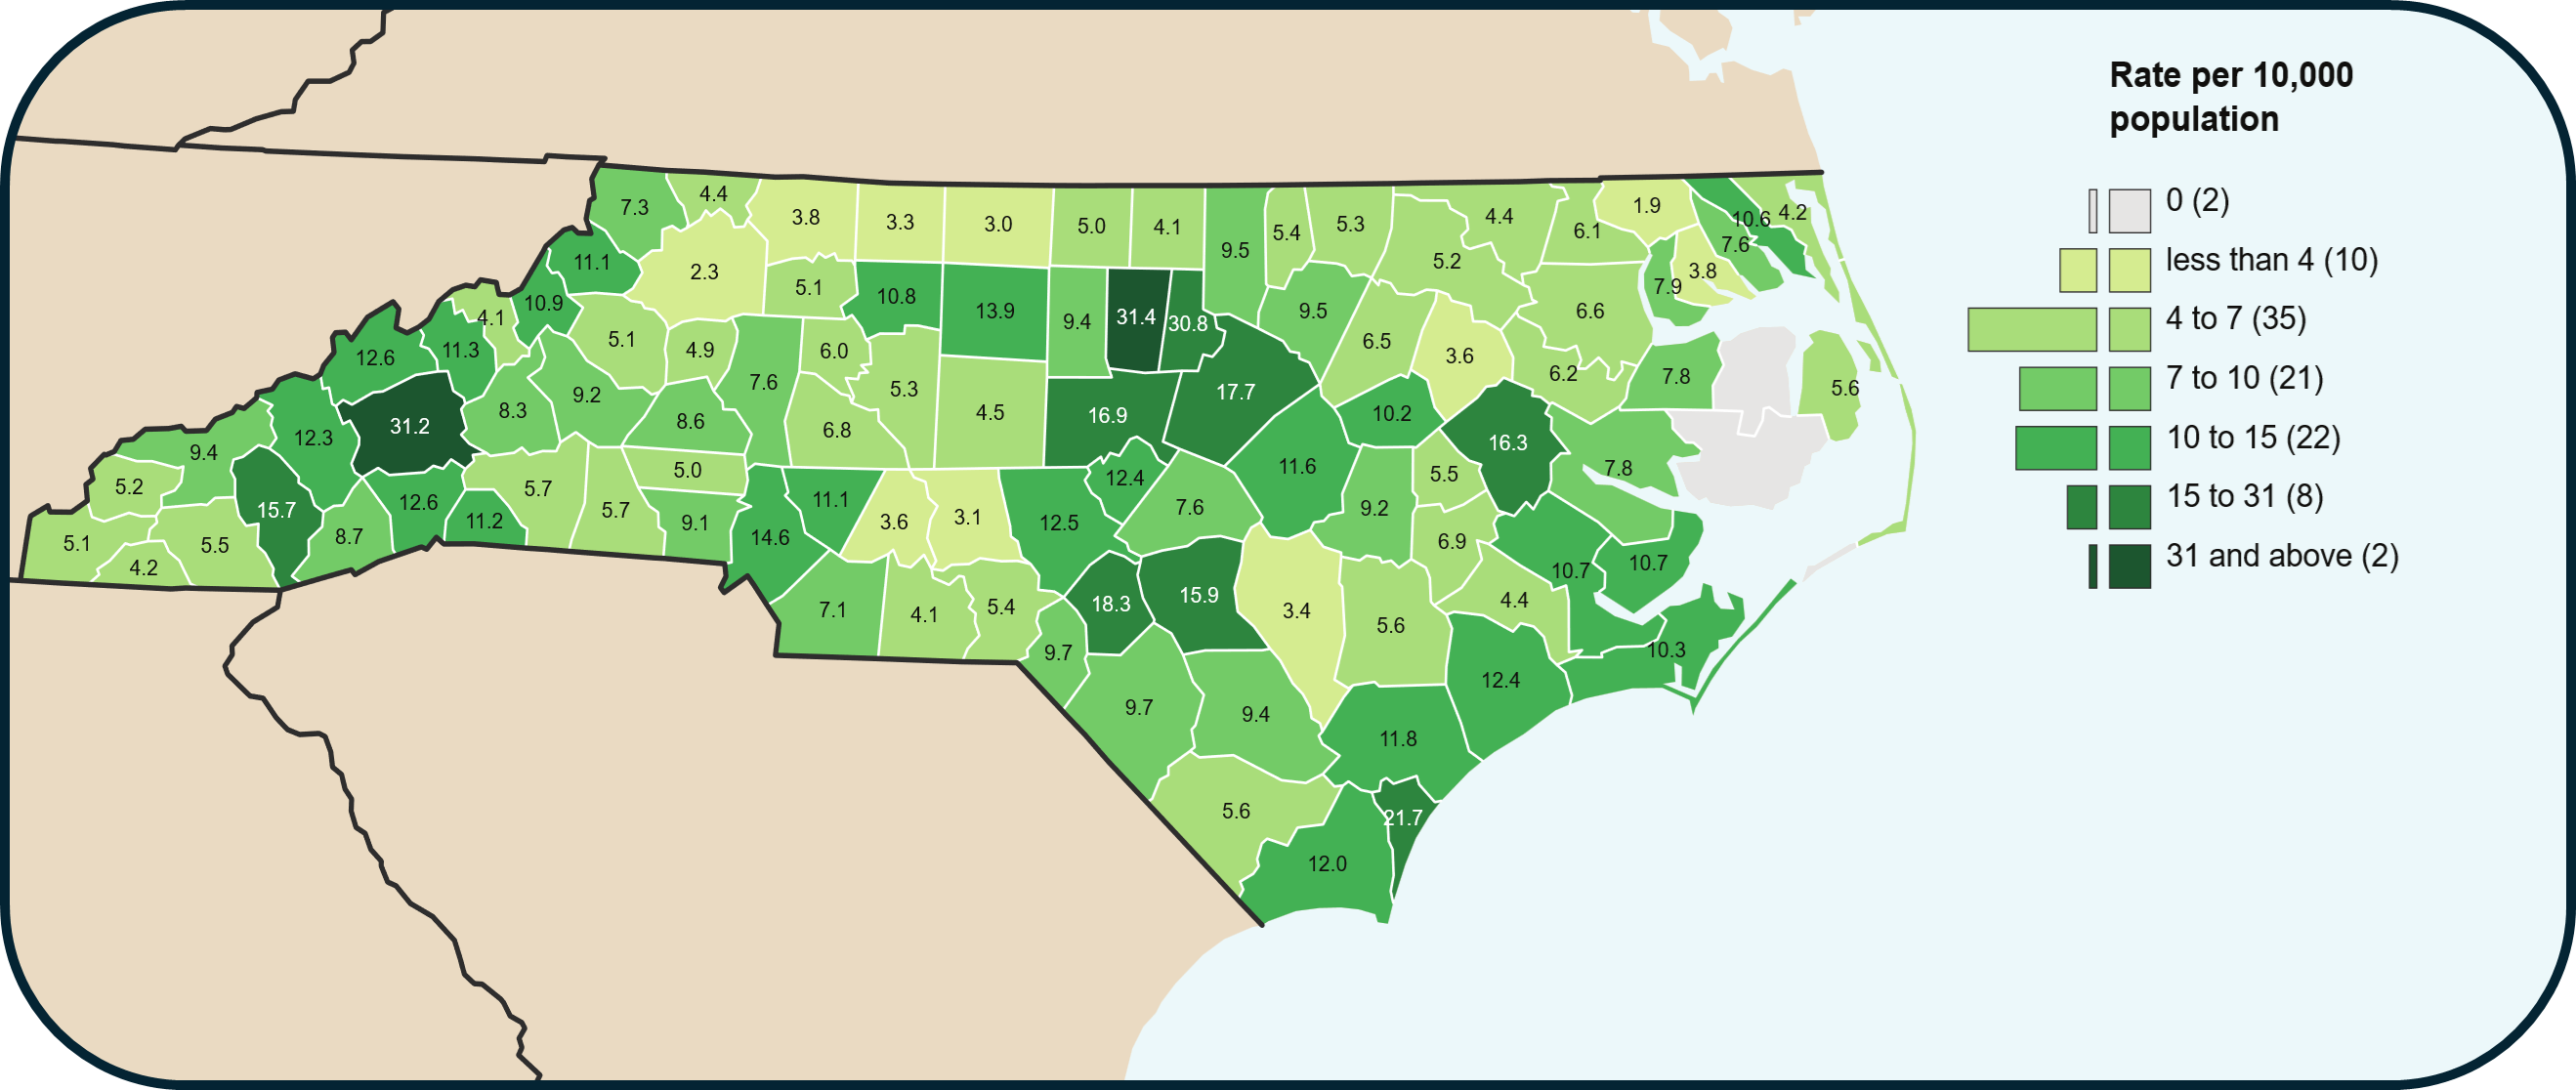
Licensed Social Workers per 10,000 Population by County, North Carolina, 2024
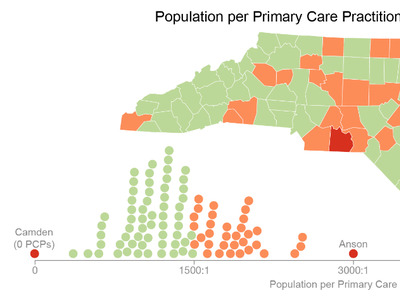
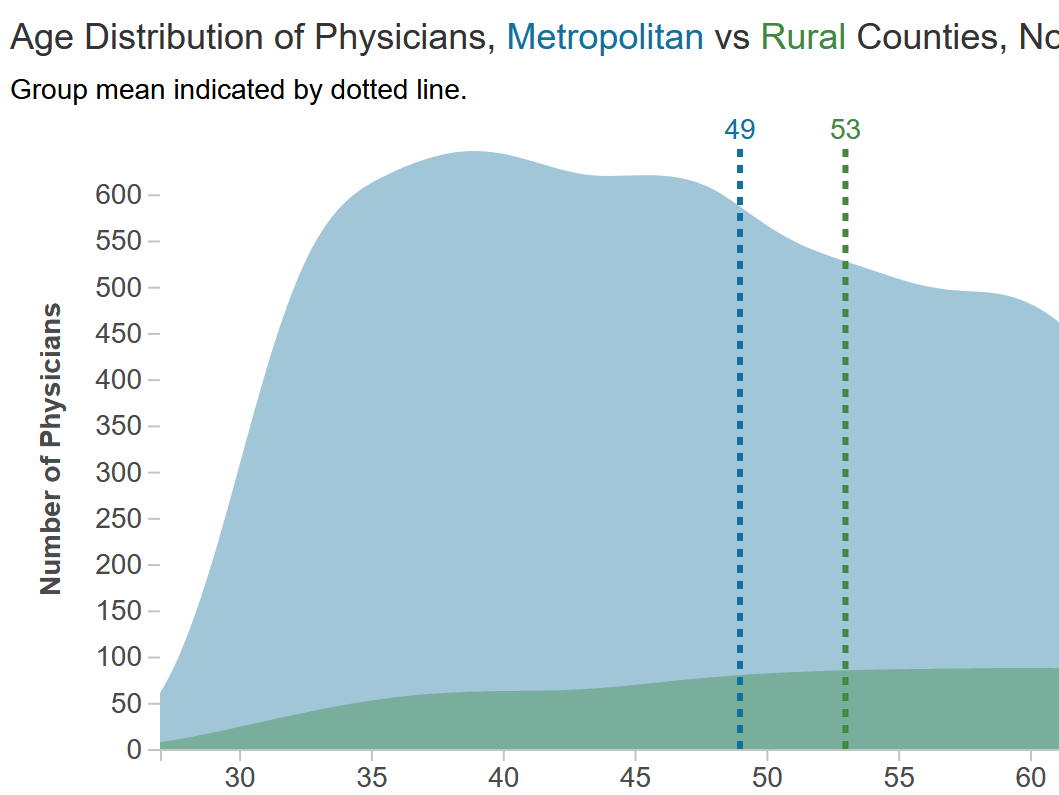
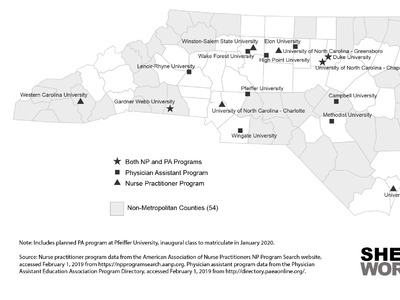
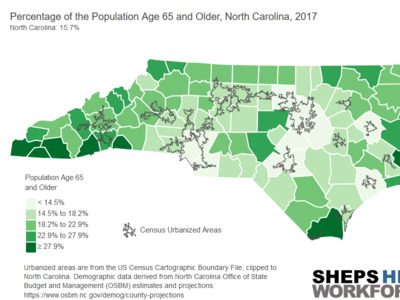
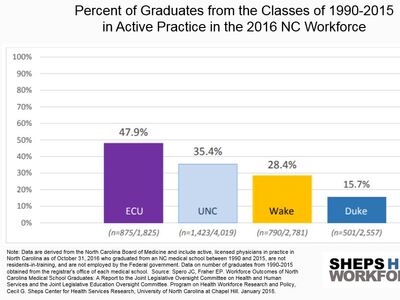
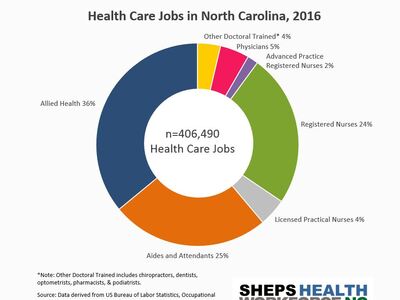
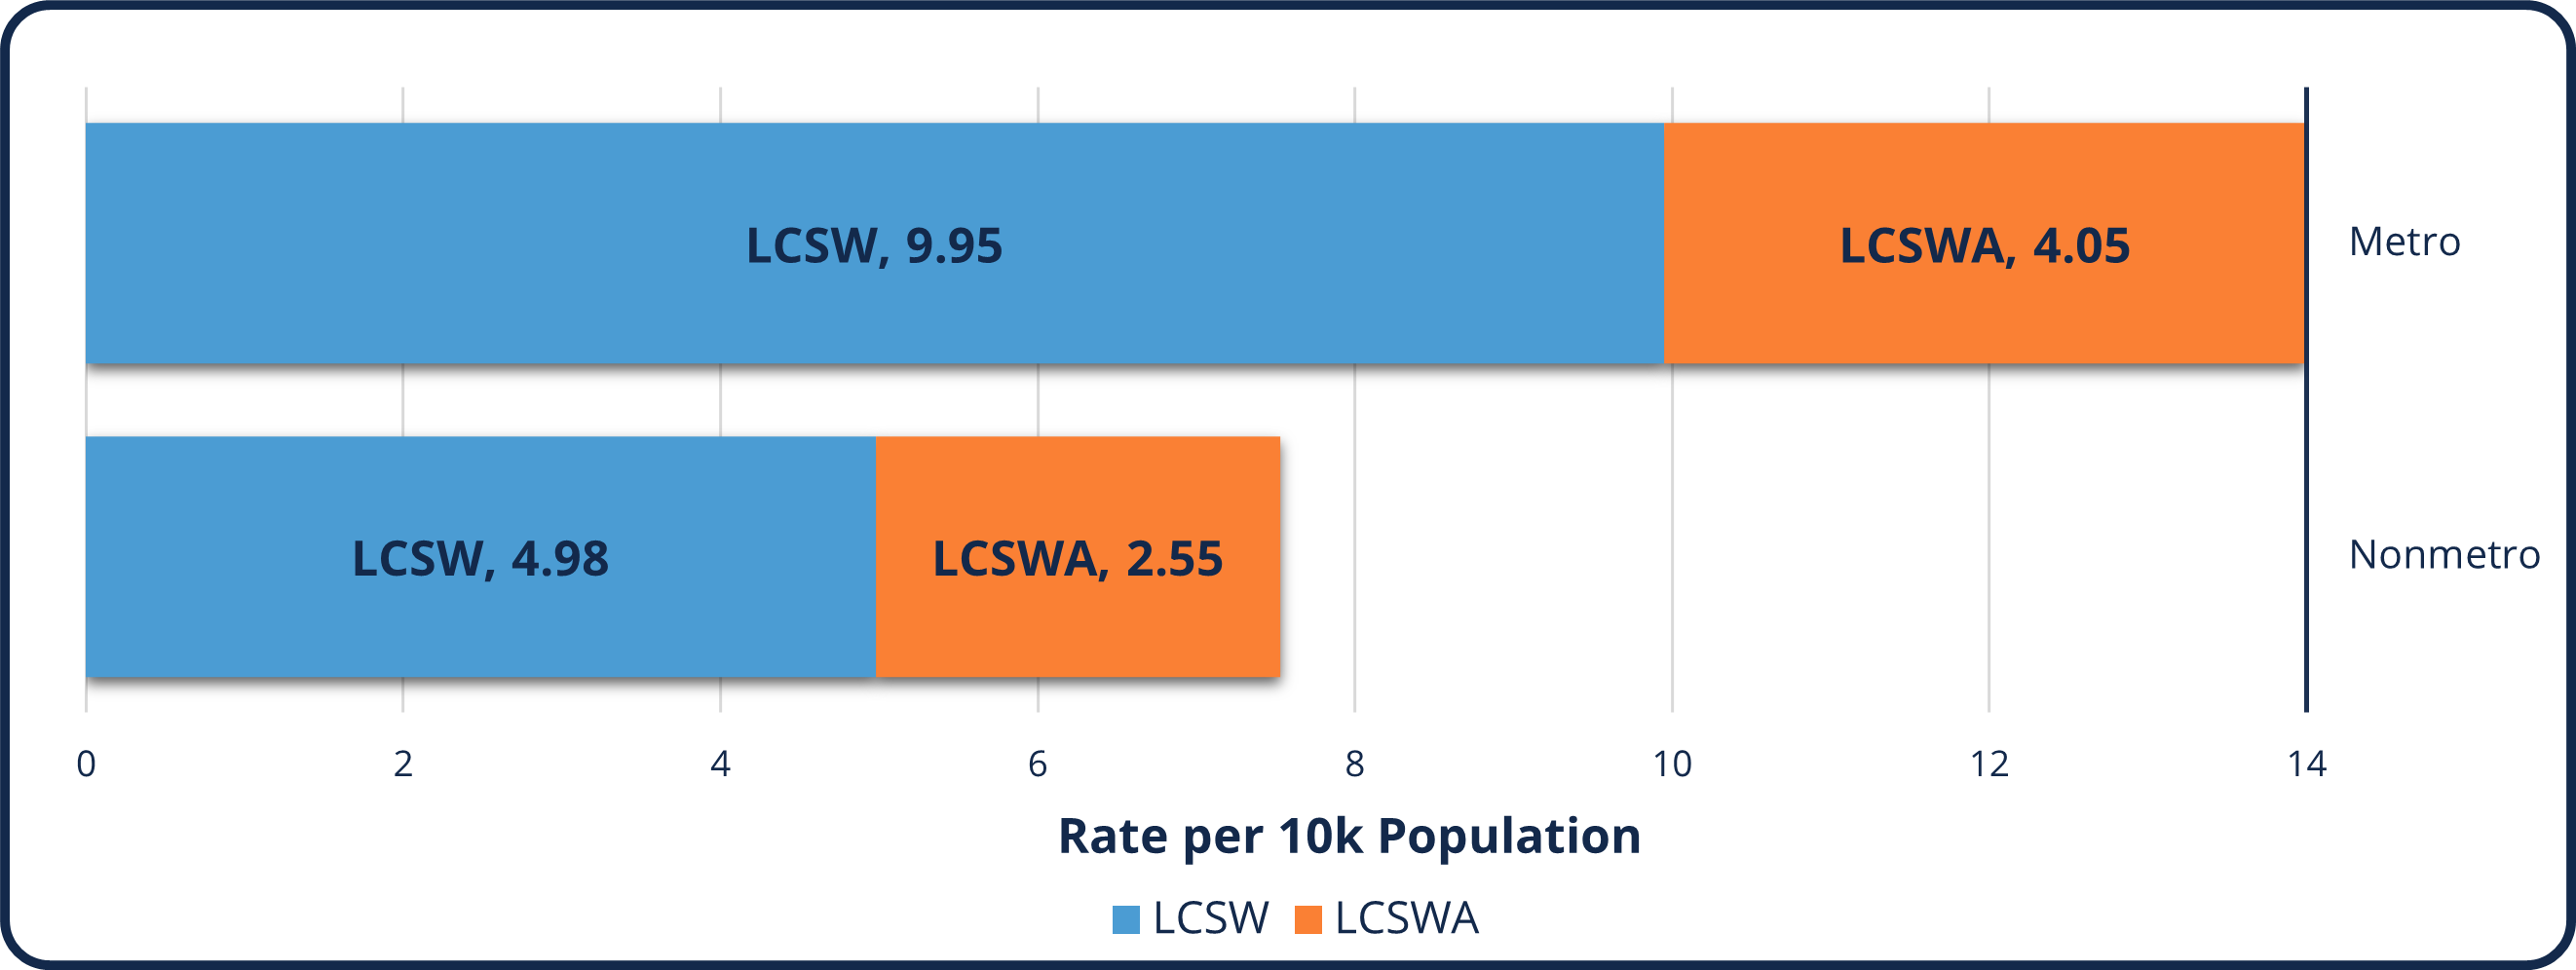
Social Workers in Metro and Nonmetro Counties by Licensure Type, 2024
Demographics
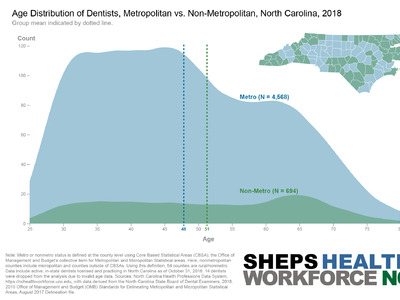
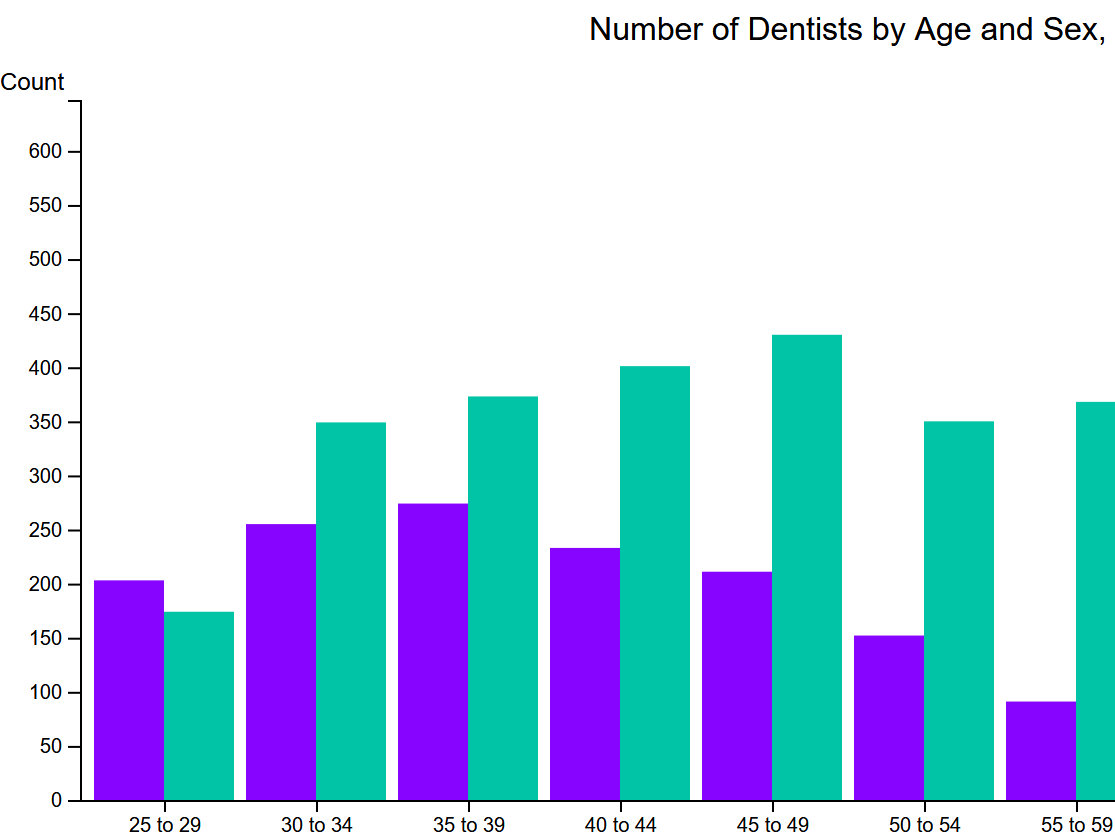
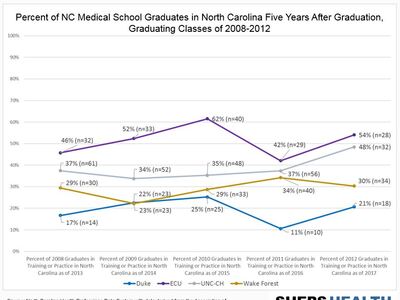
North Carolina Social Workers by Sex, 2024
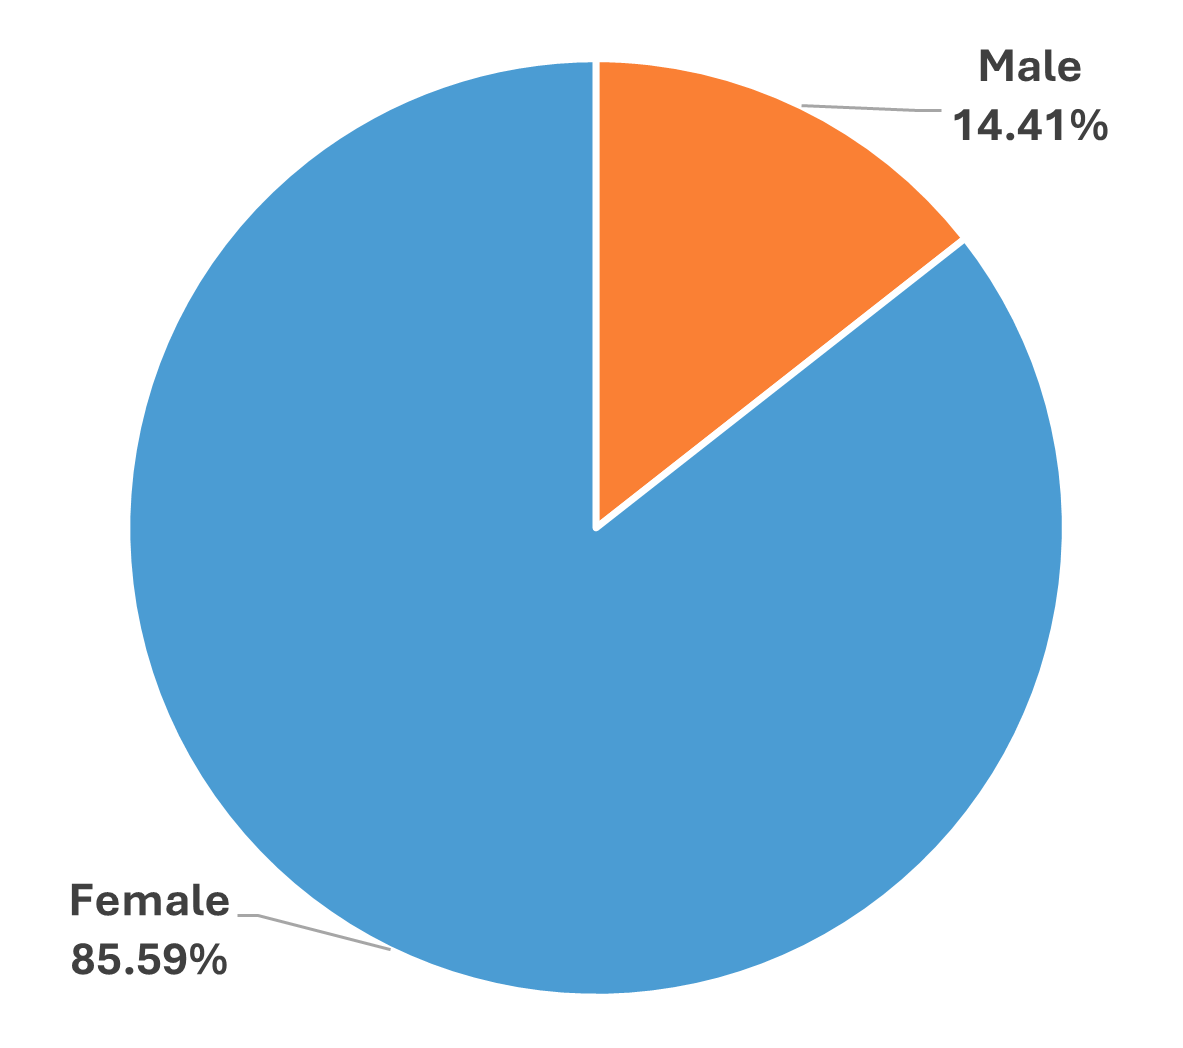
85.6% of social workers identified as female in 2024
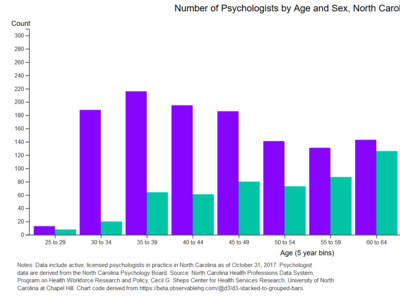
Years in Practice: LCSWs
- Average number of years: 9.7
- Deviation from the average (SD): 8.6 years
- Minimum/Maximum years in Practice (Range): 0 – 38
- 63% licensed 10 years or less
Key Takeaways
- Metro counties had nearly double the rate of LCSWs vs nonmetro areas: 9.95 vs 4.98 per 10k.
- The state average was 12.7 social workers per 10,000 population, with wide variability across counties.
- Two counties had a rate of 0 social workers per 10,000 population.
- Two counties had rates higher than 31 social workers per 10,000 population.
- There were 2:1 LCSWs to LCSWAs in North Carolina.
Note: Data for Social Workers by sex are from the National Plan and Provider Enumeration System (NPPES). All Other Graduate-Level Clinicians include: Licensed Psychologists, Licensed Psychological Associates, Licensed Marriage & Family Therapists, Licensed Marriage & Family Therapist Associates, Pastoral Counselors, Licensed Clinical Mental Health Counselors, and Licensed Clinical Mental Health Counselor Associates. Figure data can be found here
Suggested Citation: Lombardi BM, Headley J, Jimenez MP; Keesler R, Akue-ka AJB; Gregory R; Galloway E; Zerden LD; Fraher E. North Carolina Mental Health & Substance Use Services Workforce Data Snapshot 2024: Social Work (Licensed Clinical Social Workers & Associates). Program on Health Workforce Research and Policy. Cecil G. Sheps Center for Health Services Research. The University of North Carolina at Chapel Hill. March 25, 2026.