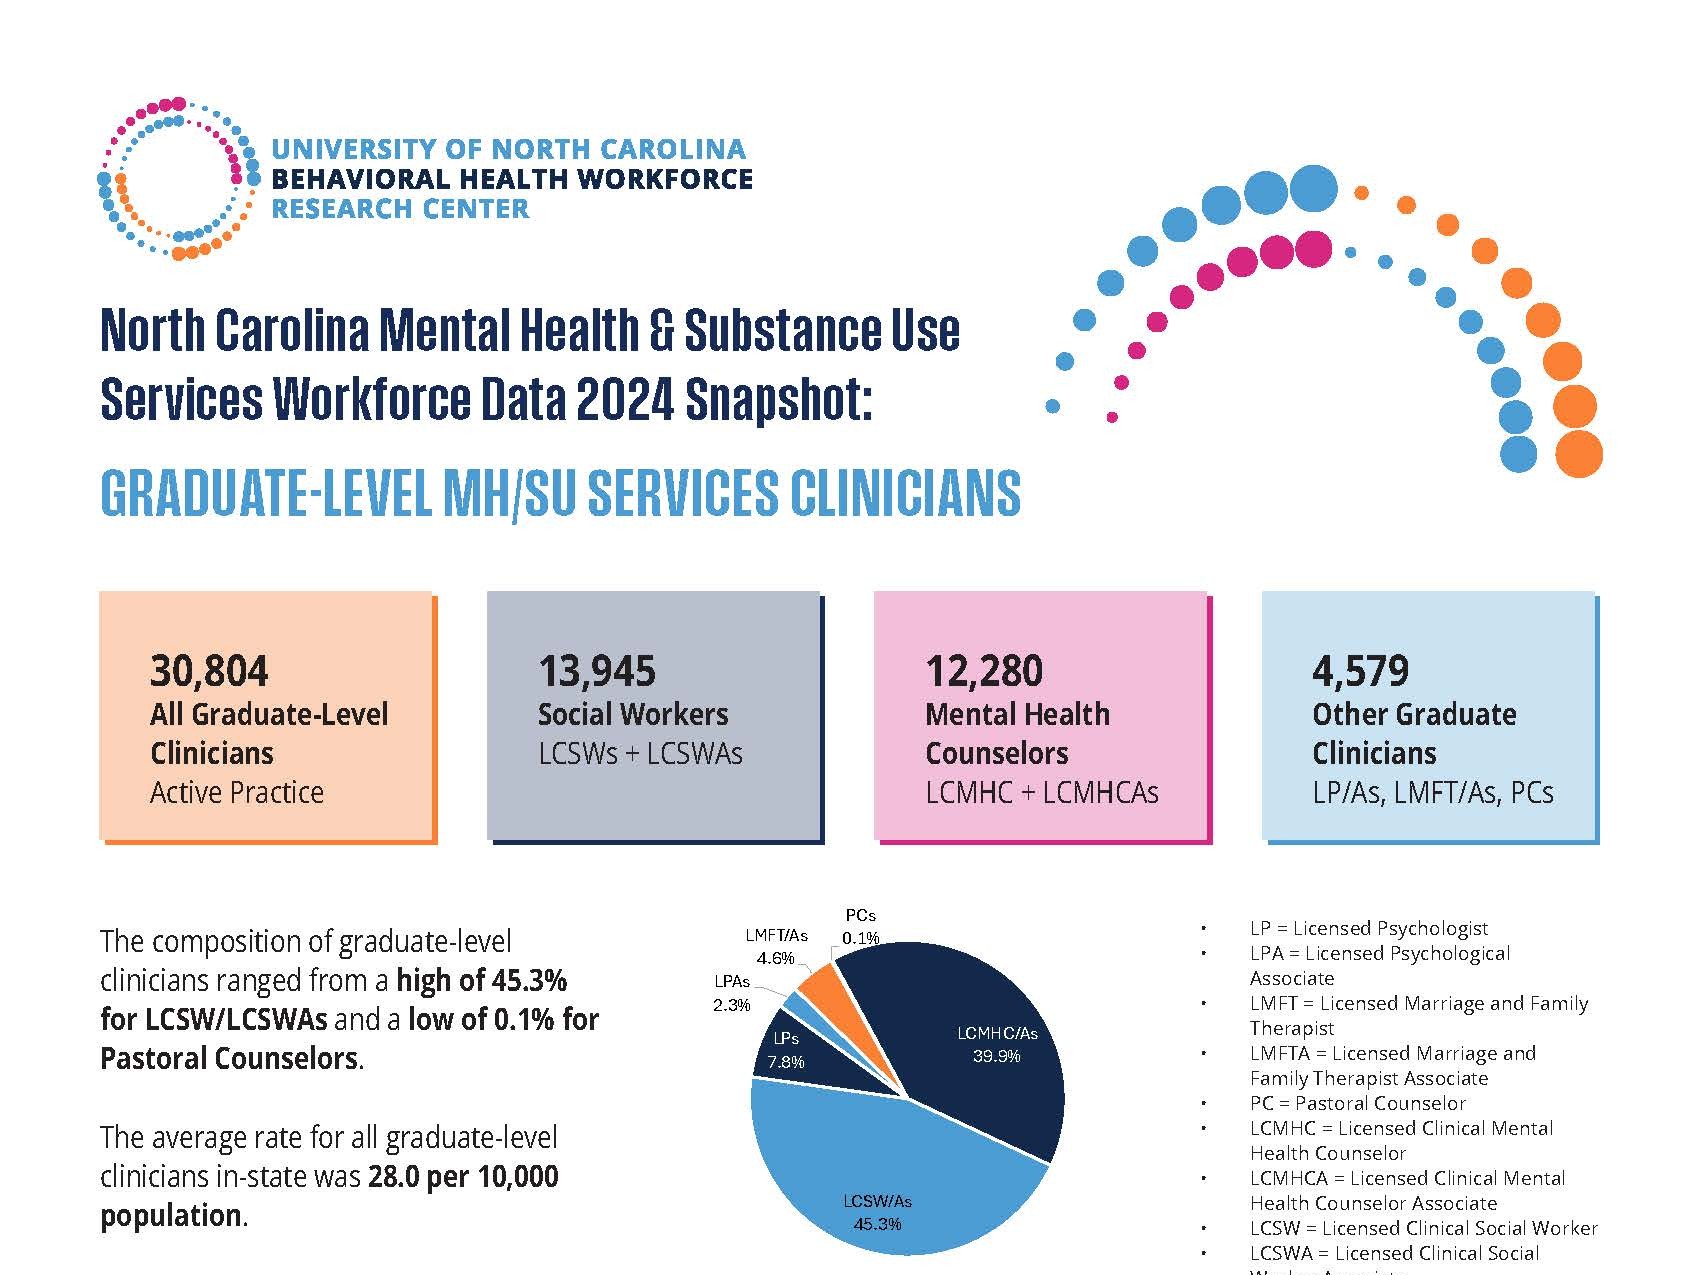
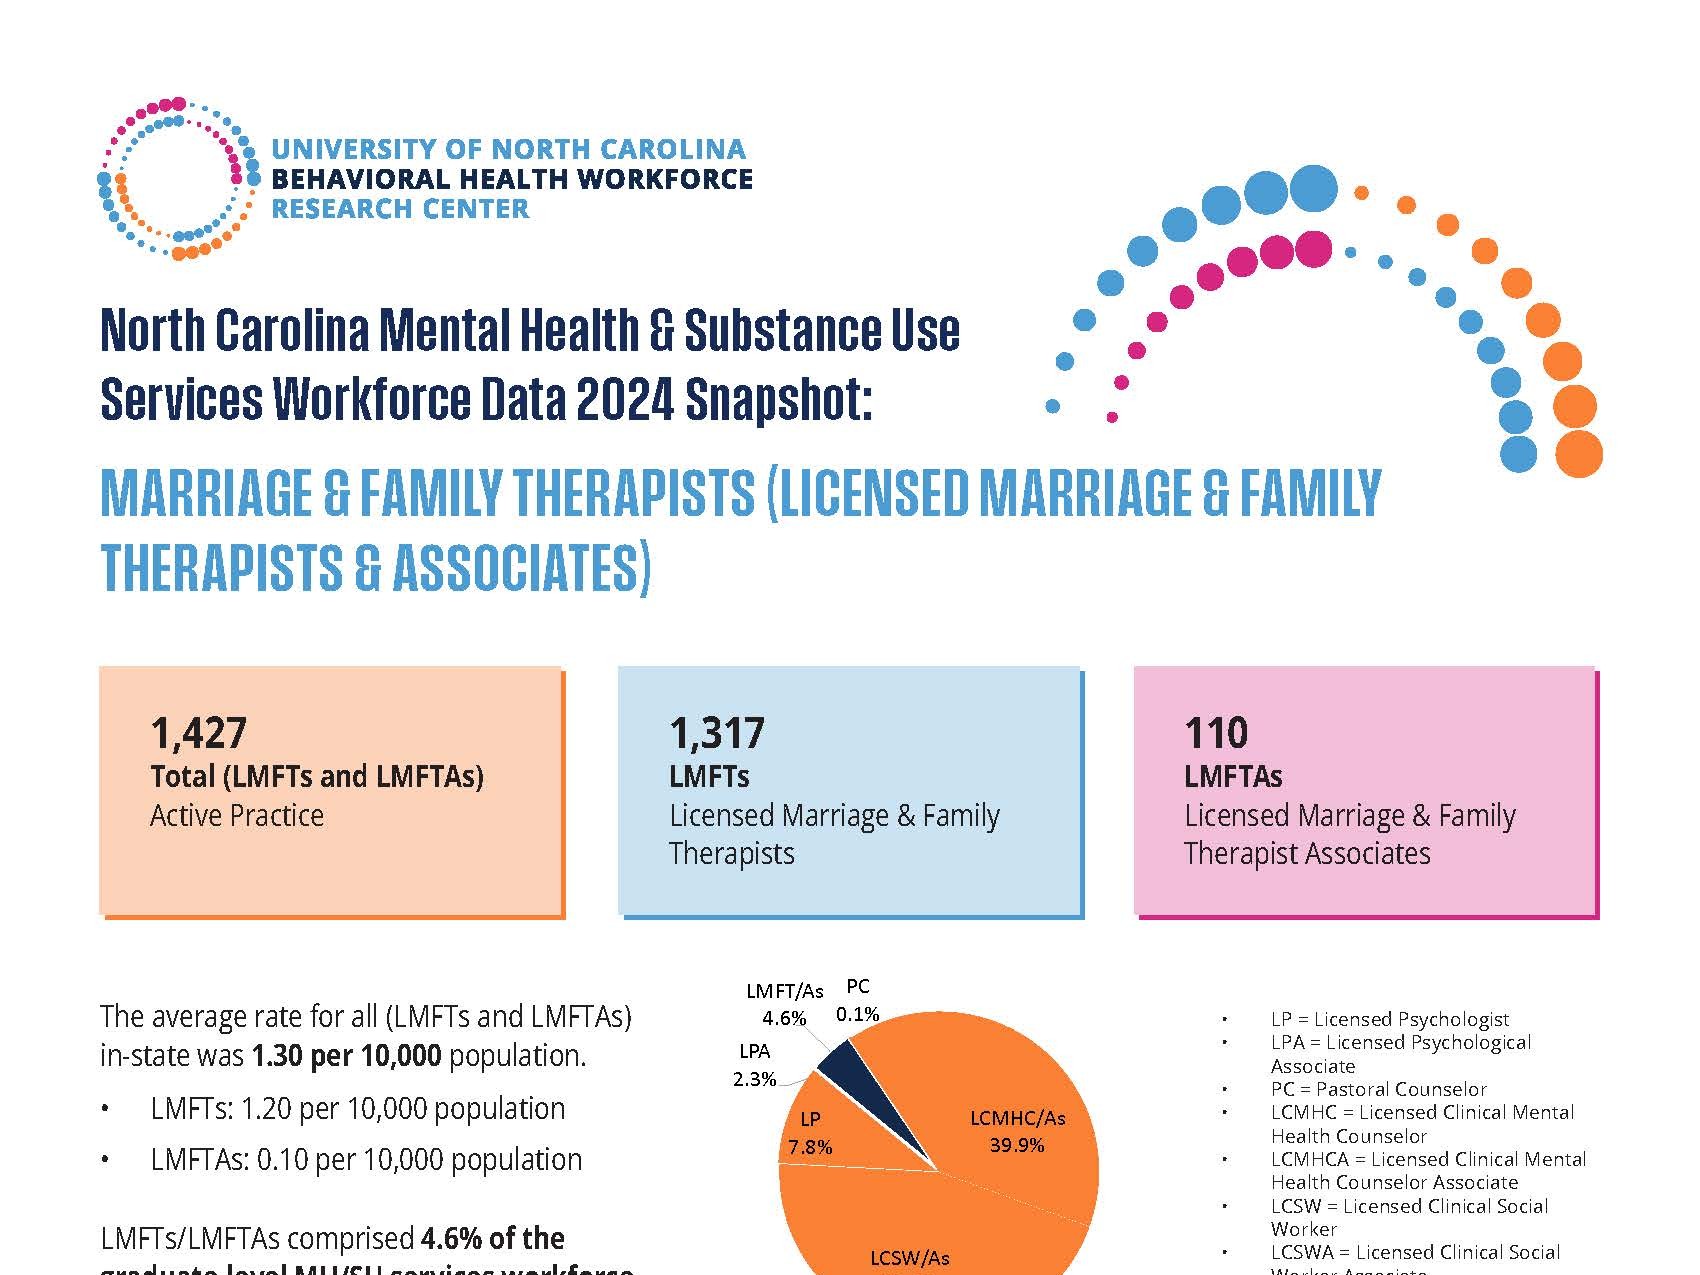
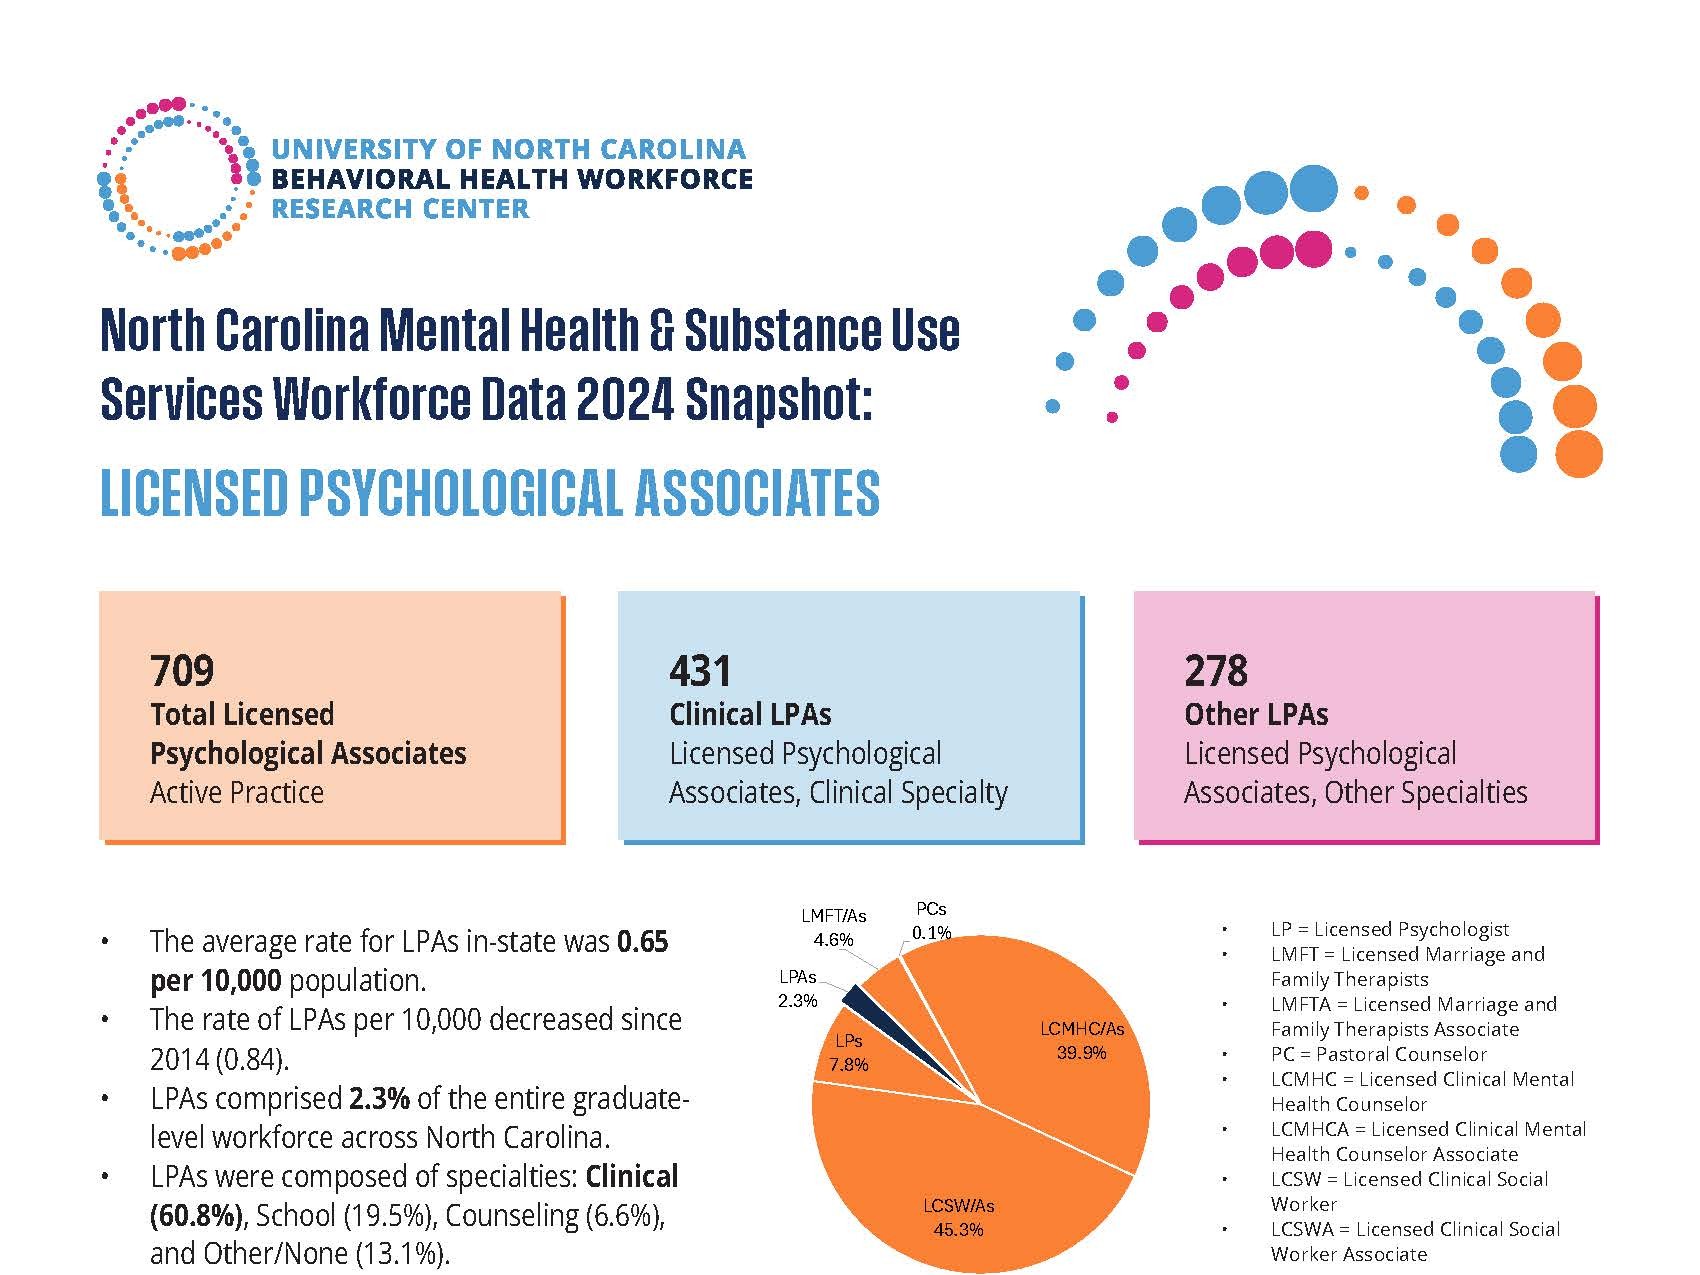
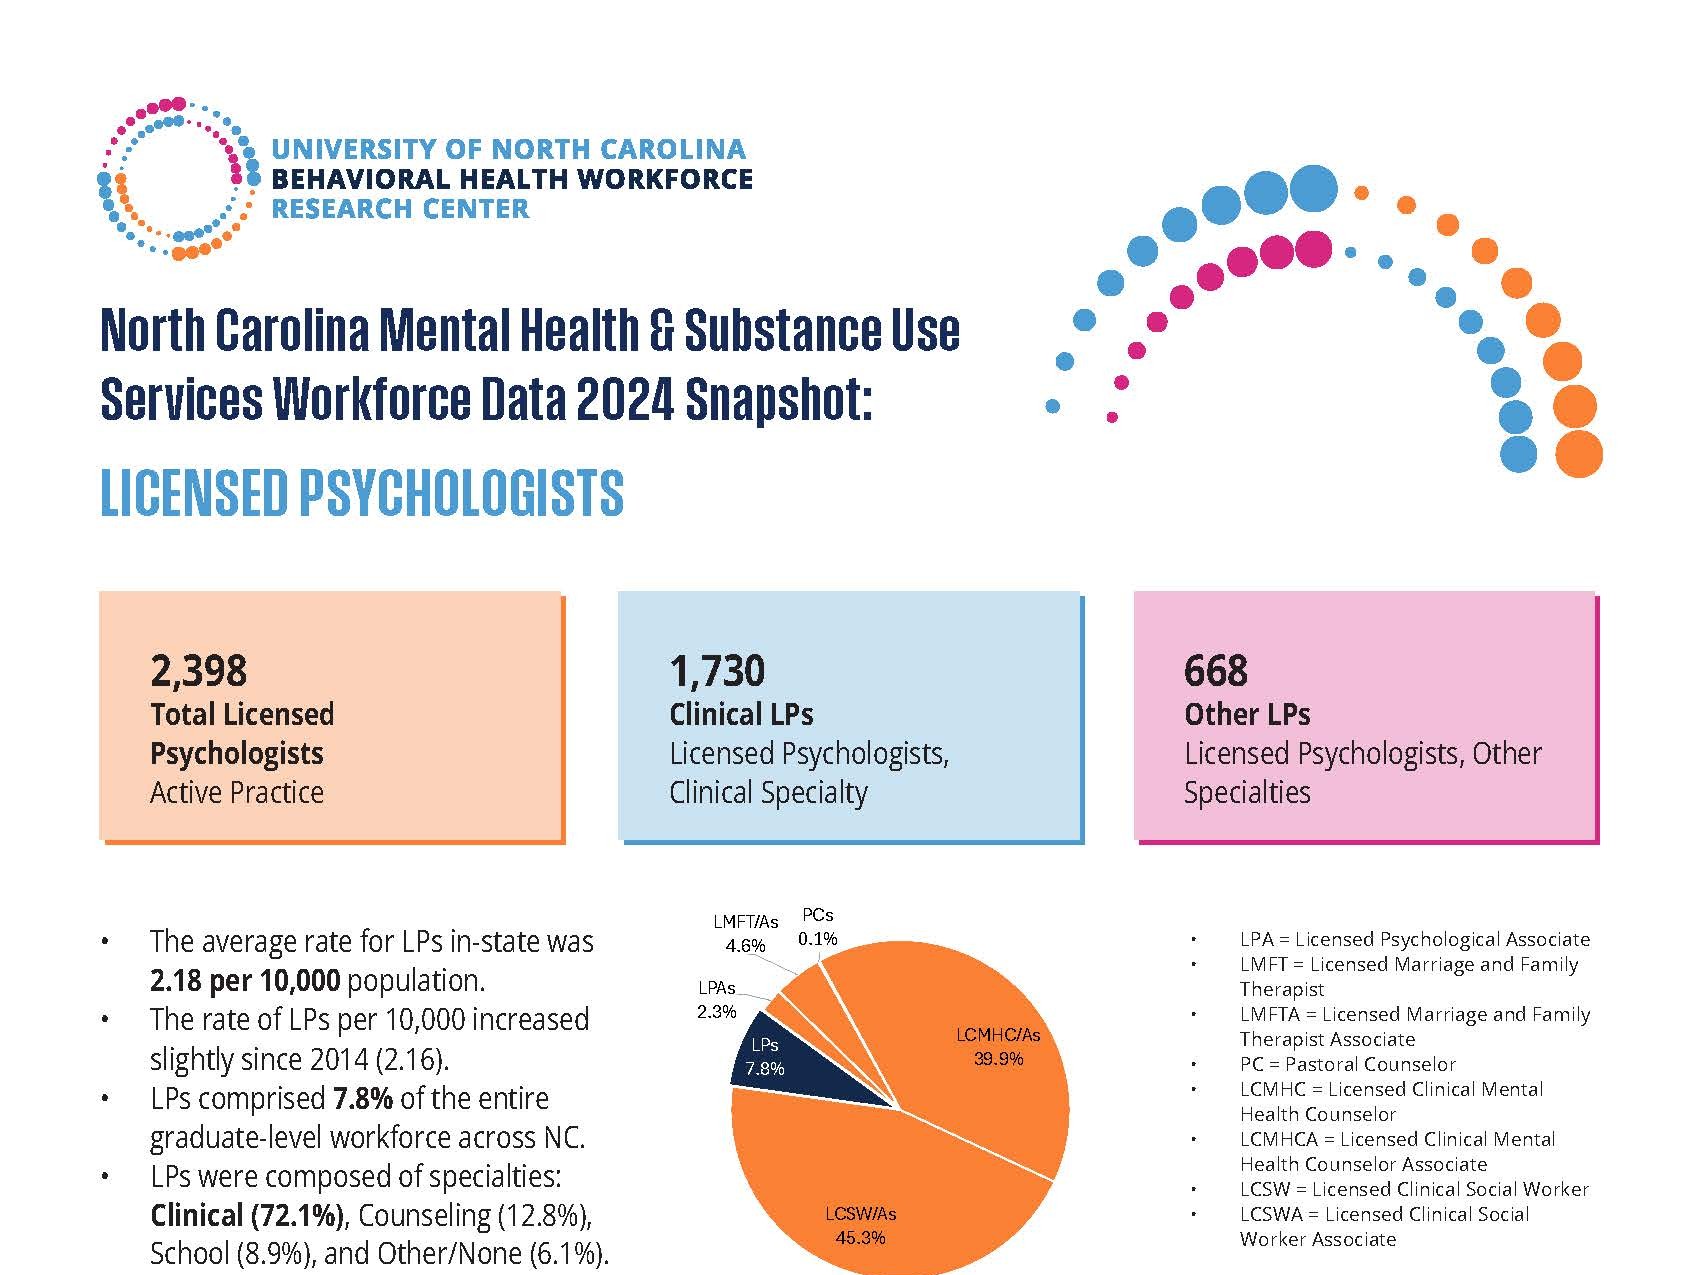
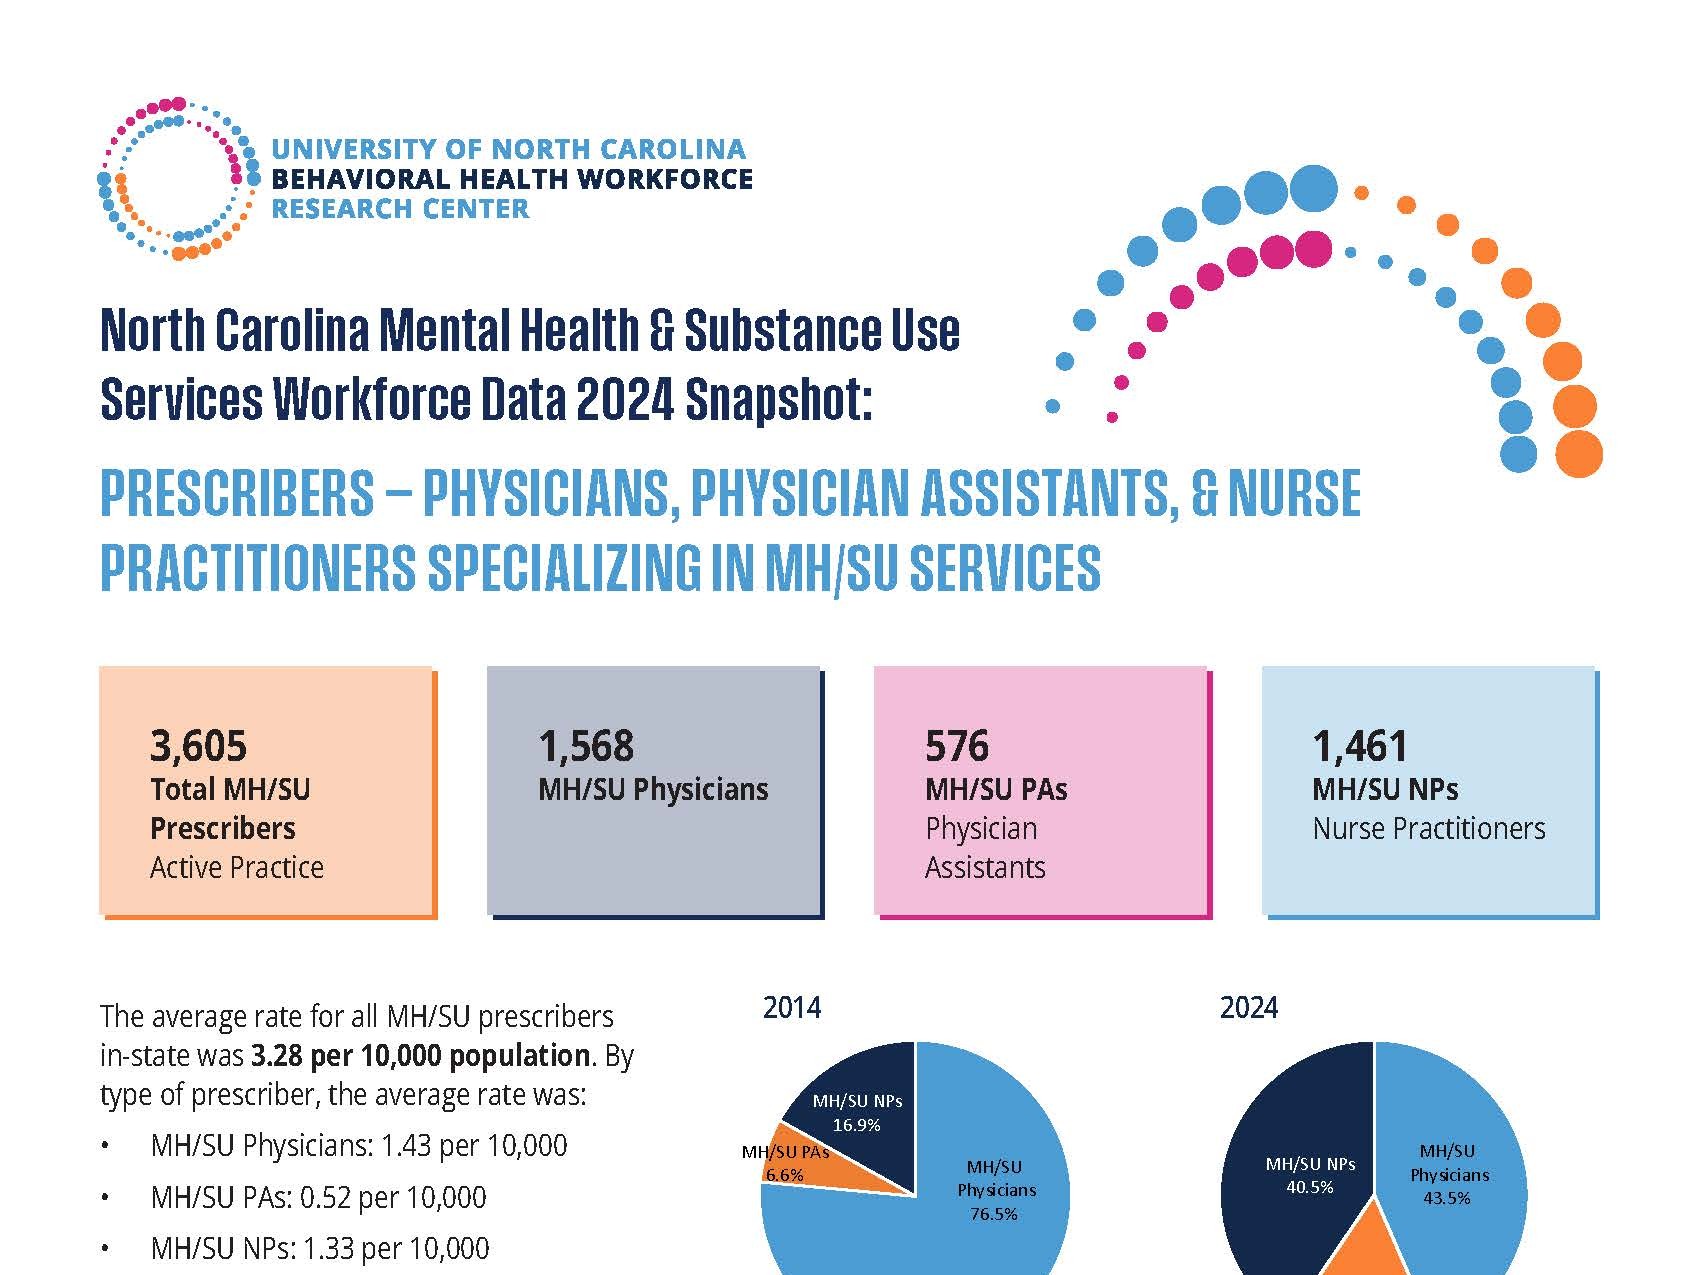
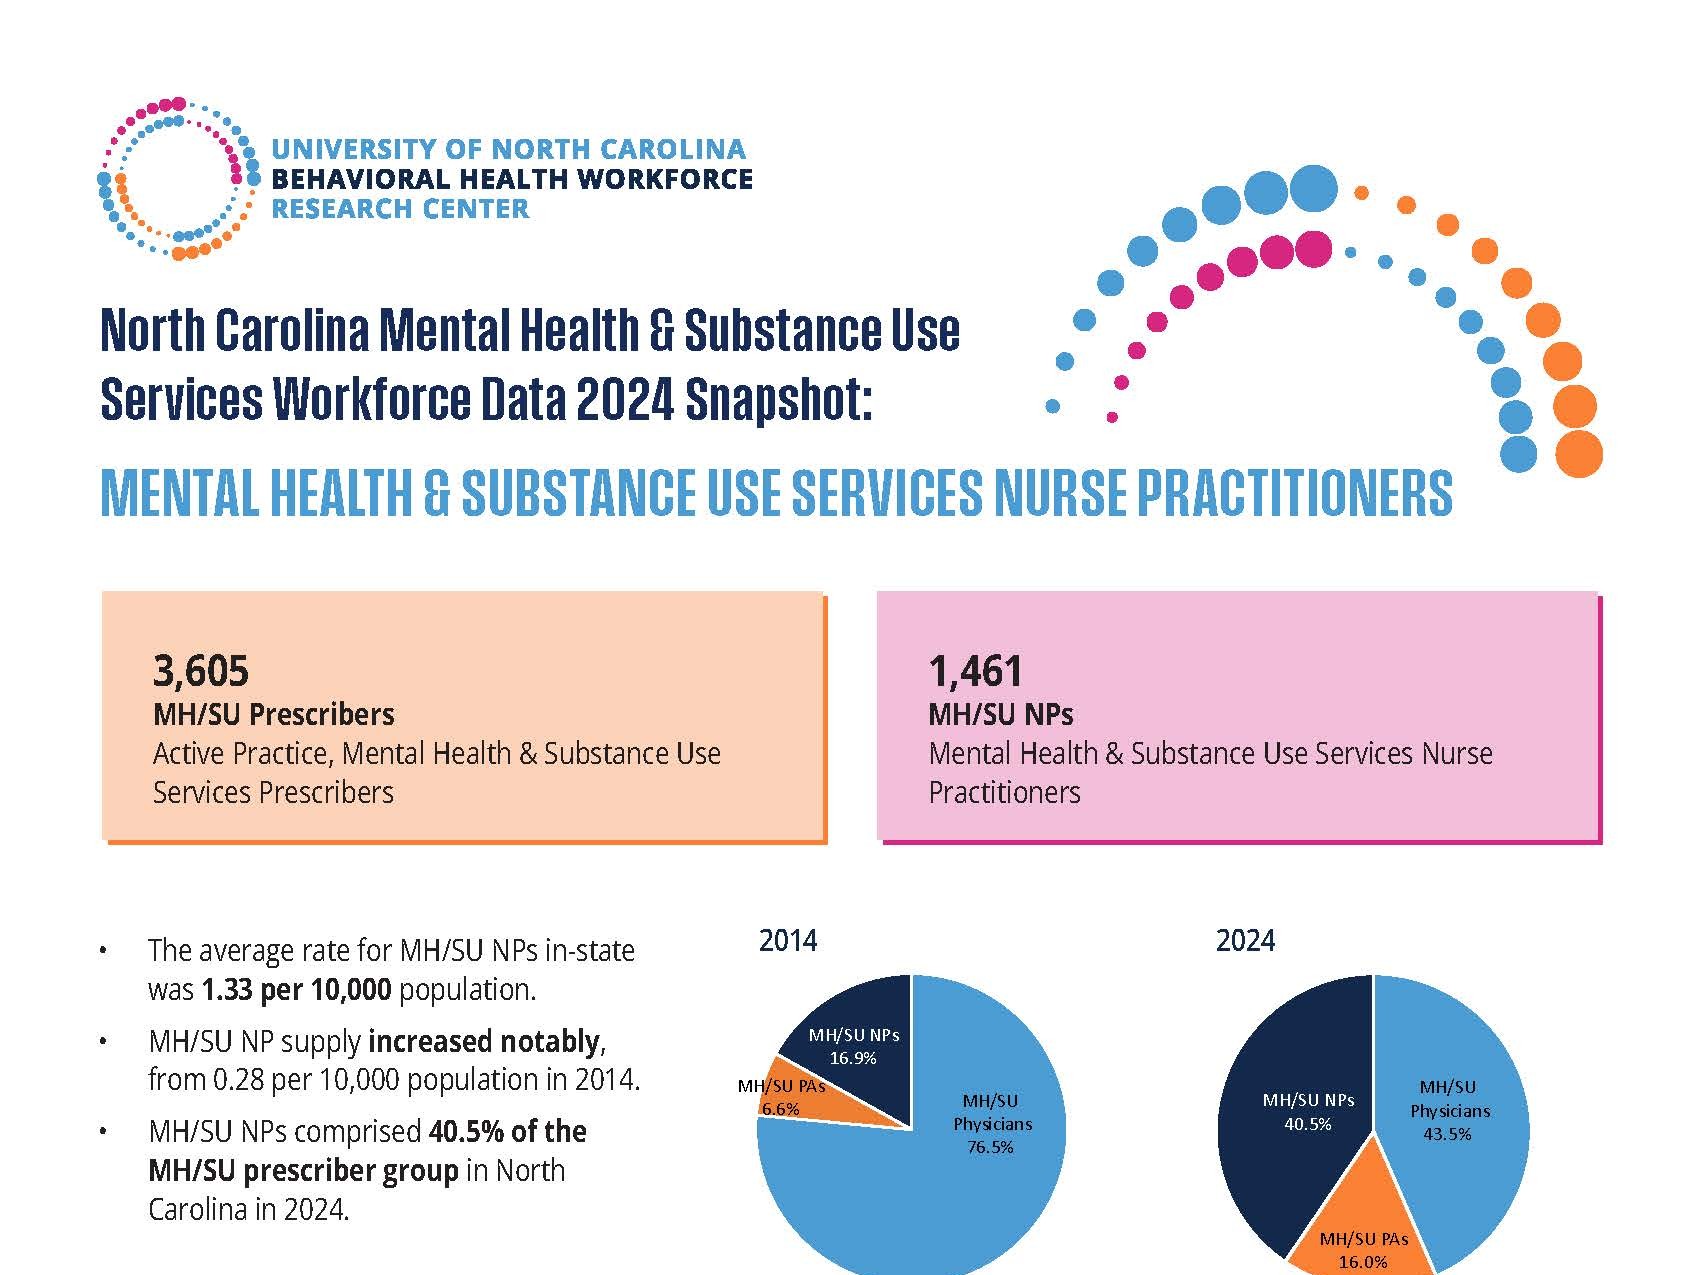
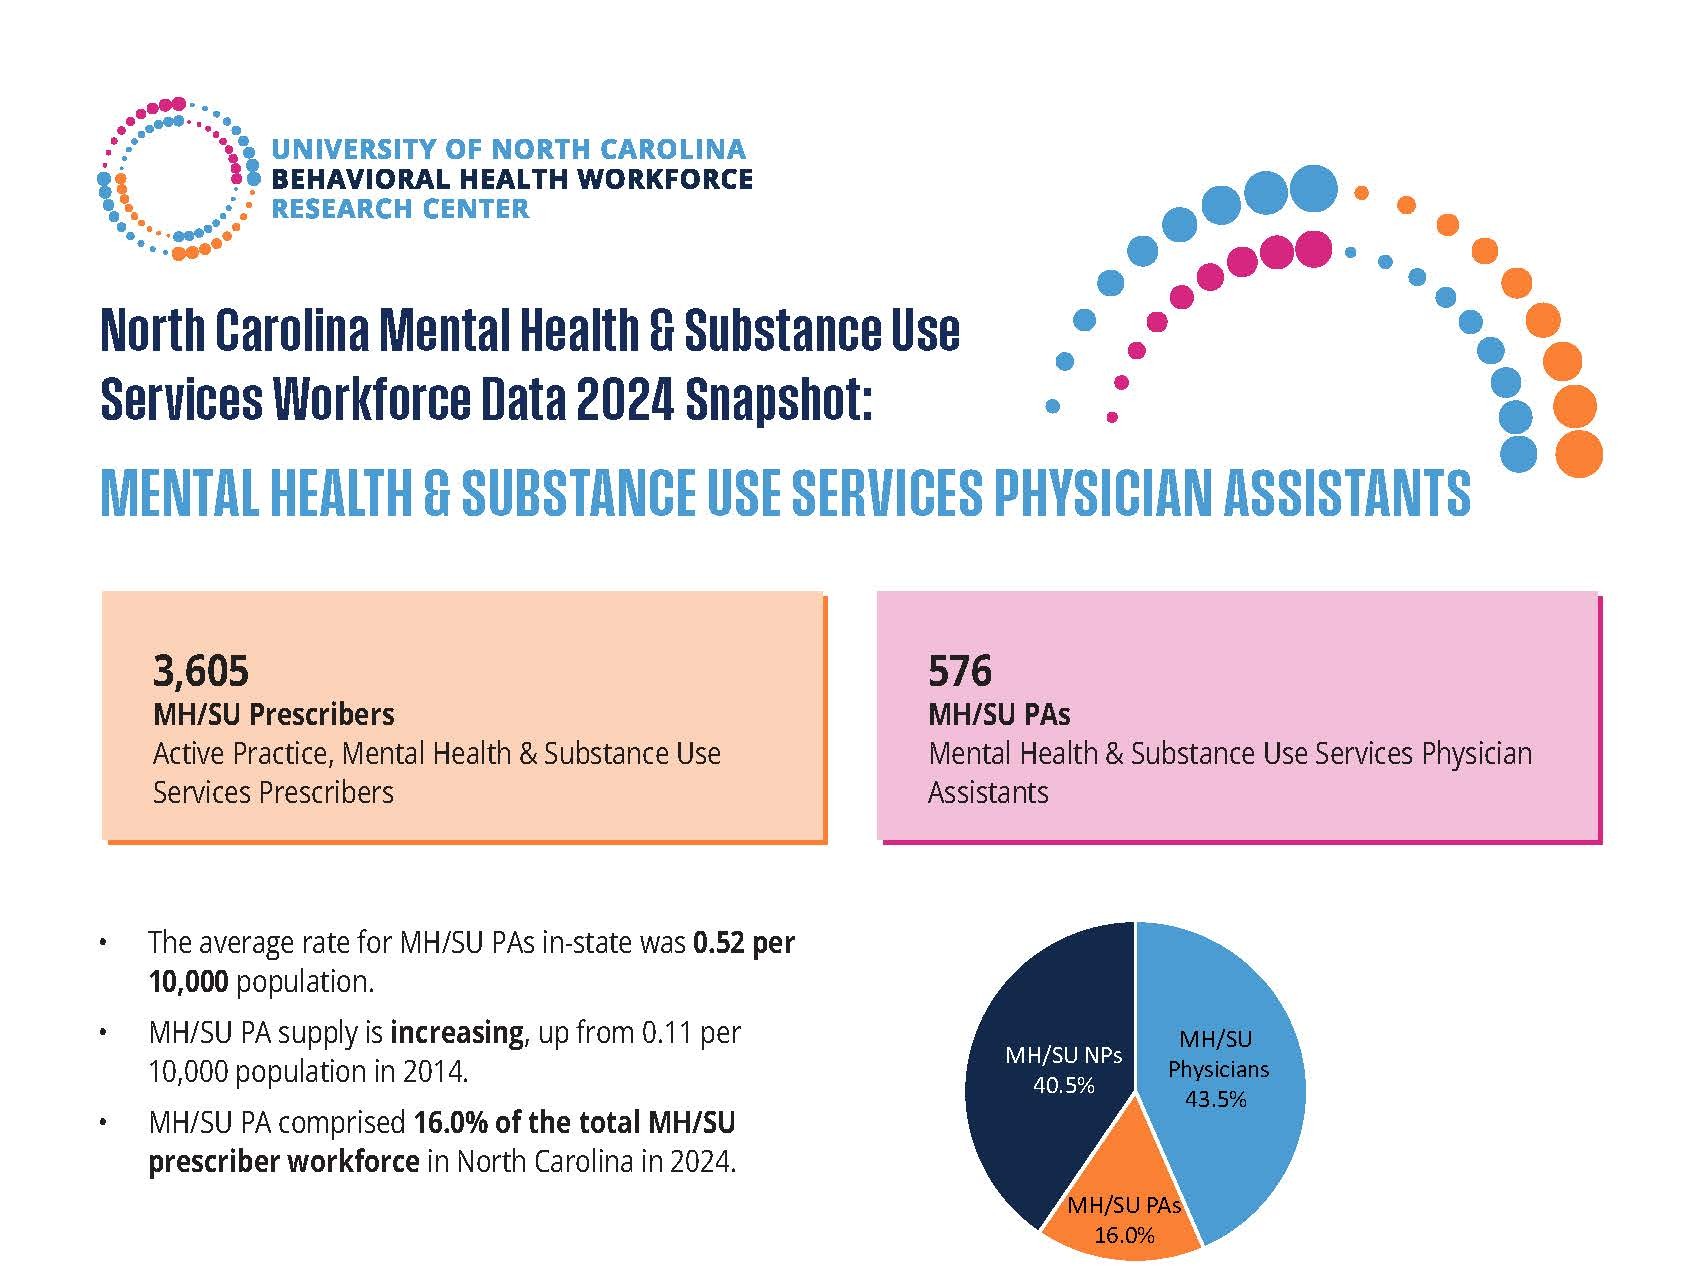
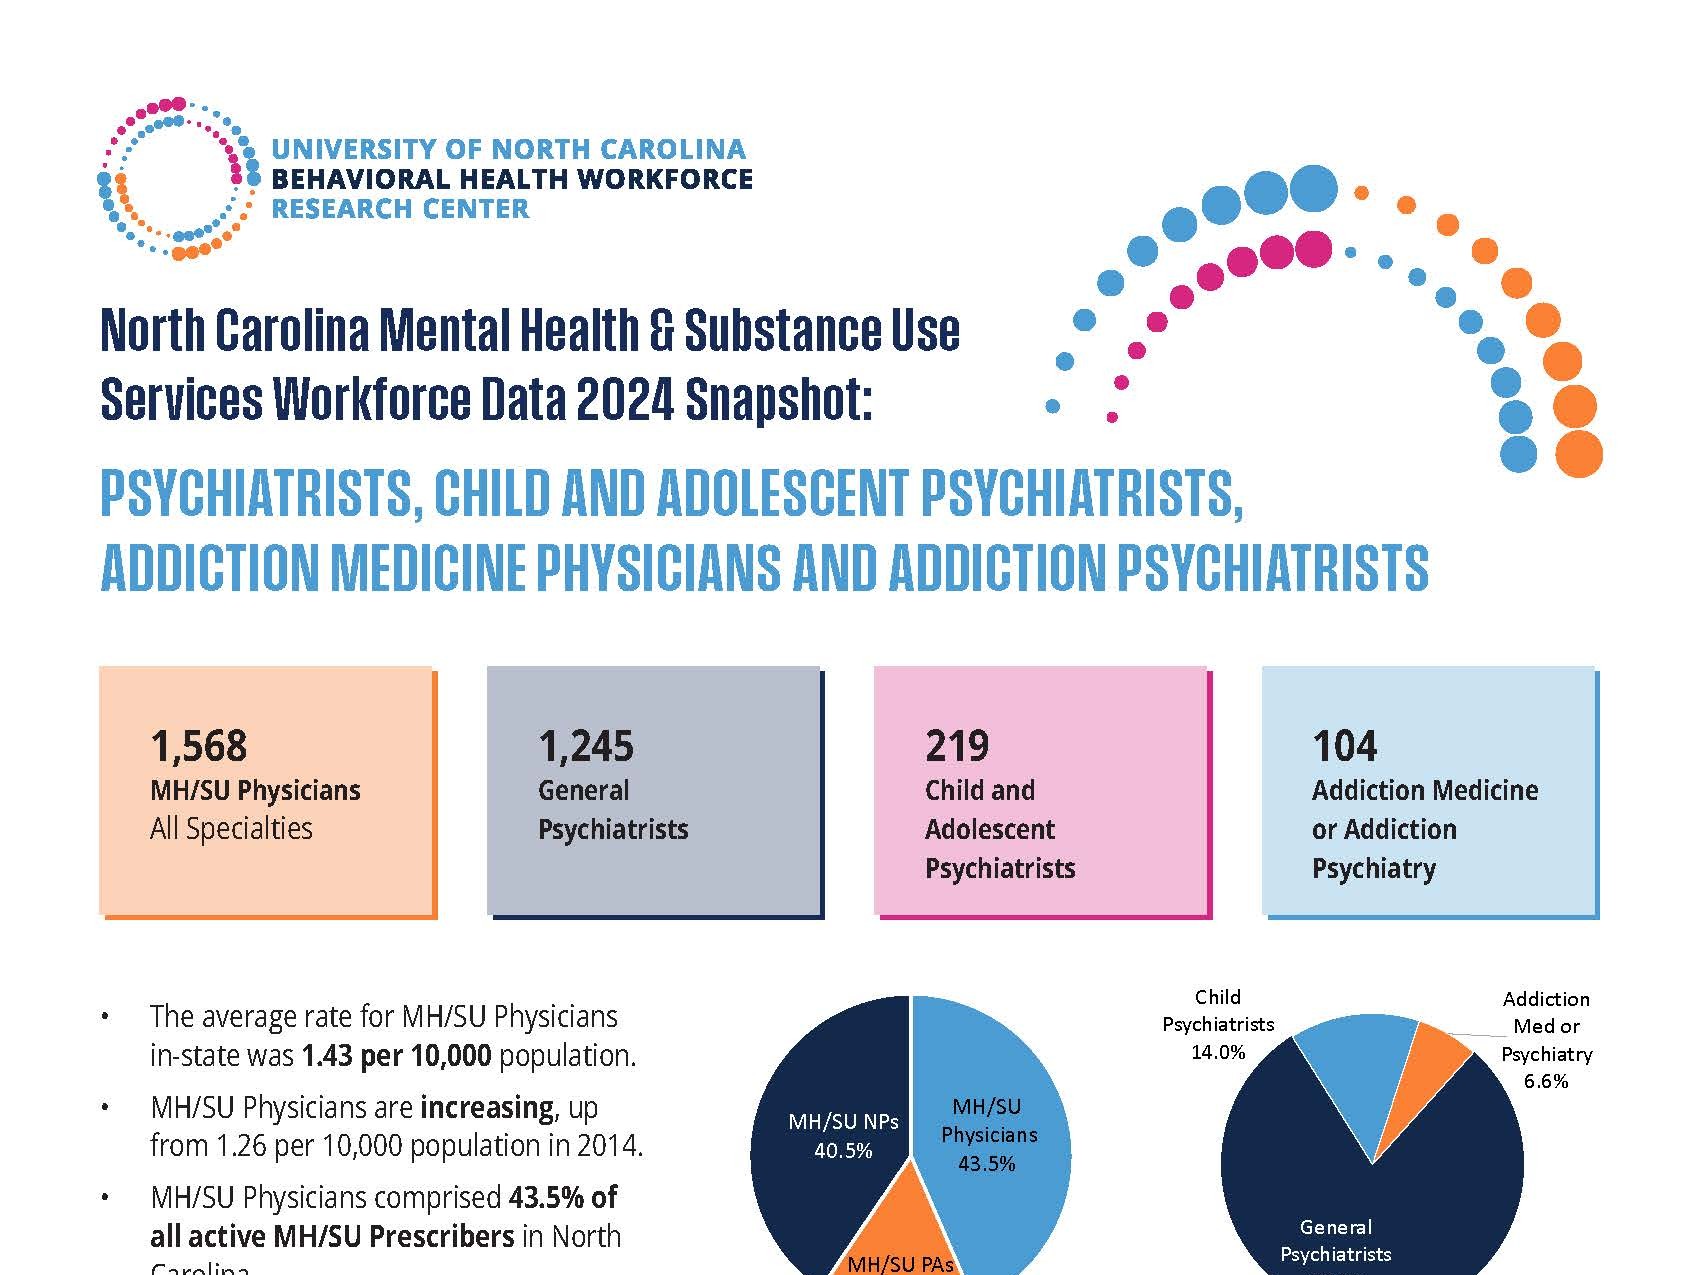
Is Access to Primary Care Clinicians Improving in North Carolina? A 2025 Update
By Evan Galloway
Jun 22, 2026
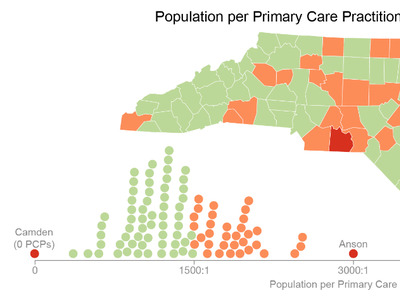
Sheps Health Workforce NC has produced a primary care clinician index since 2017 to measure geographic access to primary care in North Carolina. The primary care clinician index is a ratio of population to primary care clinicians, which includes physicians, nurse practitioners, physician assistants, and certified nurse midwives (details on the methodology for the index are provided below). A higher population to primary care clinician ratio suggests lower geographic access to primary care services. Guided by the recommendations of a federal report, we selected a ratio of 1,500 people to 1 primary care clinician or fewer as the standard of whether a county has sufficient primary care clinicians to meet population health needs. However, even in areas that fall below the 1,500:1 threshold, individuals may experience difficulty in obtaining primary care services, because of socioeconomic factors, lack of insurance, and other barriers. This blog updates the index through 2025.1,2,3
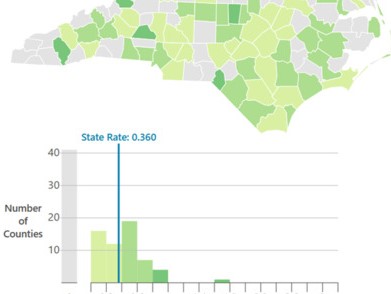
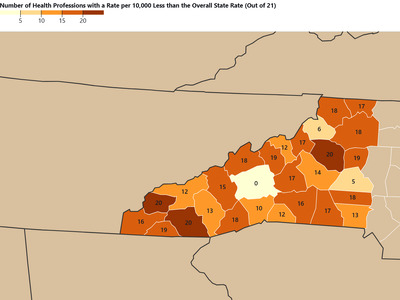
Overall, the ratio for the state improved from 983 people:1 primare care clinician in 2017 to 738 people:1 primary care clinician in 2025. Among NC’s 100 counties, 79 were at or below the 1,500:1 ratio in 2025. Figure 1 shows the 2025 index by county relative to the 1,500:1 benchmark. Purple counties have better access to primary care than the 1,500:1 benchmark (fewer people per clinician), while orange counties fall short of it.
Figure 1: Primary Care Clinician Index by County, North Carolina, 2025

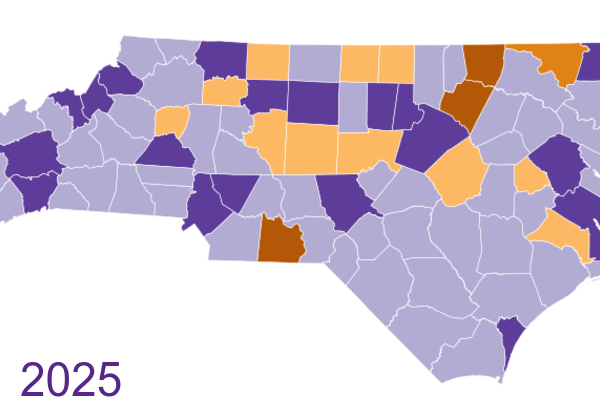
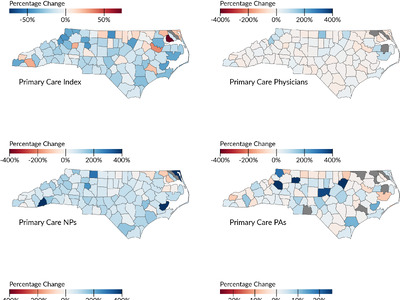
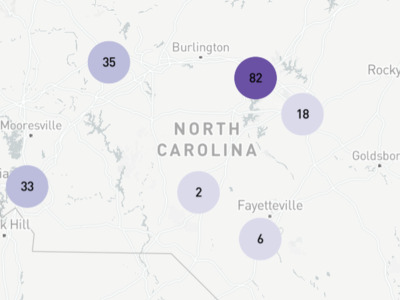
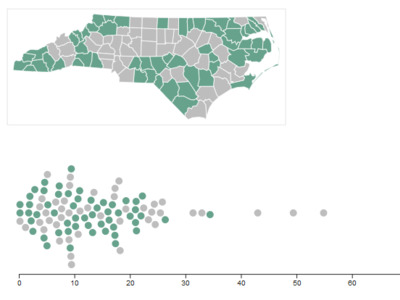
Figure 2 shows the percentage change in the index by county between 2017 and 2025. Purple indicates counties where the number of people per primary care clinician decreased (access improved), while orange indicates counties where the number of people per primary care clinician increased (access worsened). Primary care access improved in 91 of North Carolina’s 100 counties between 2017 and 2025, with most gains between 10% and 40%. Only nine counties worsened, but some of these are small, rural counties where a single clinician can swing the ratio sharply. Camden County is shown in gray because it had no primary care clinicians in 2017 and gained two clinicans by 2025, a clear improvement that cannot be calculated as percentage change.
Figure 2: Percentage Change in the Primary Care Clinician Index by County, North Carolina, 2017-2025

The underlying county- and state-level index values for 2017 through 2025 are available to download as an Excel workbook (with a data dictionary and notes on the first sheet): pcc_index_2017-2025.xlsx.
Notes: Primary care physicians, physician assistants, and nurse practitioners are defined as in Spero JC & Galloway EM. (2019) Running the Numbers. North Carolina Medical Journal, 80(3), 186-190. Physicians and physician assistants with a primary area of practice of obstetrics/gynecology were weighted as 0.25 of a full-time equivalent (FTE) primary care clinician. All other primary care physicians were weighted as 1 FTE. All other primary care physician assistants, nurse practitioners, and certified nurse midwives were weighted as 0.75 FTE. Physician and physician assistant data are derived from licensure data provided by the North Carolina Medical Board. This analysis only includes physicians who are not residents-in-training and are not employed by the Federal government. Nurse practitioner and certified nurse midwife data is derived from licensure data provided by the North Carolina Board of Nursing. Data include active, licensed clinicians in practice in North Carolina as of October 31 of each year. Clinicians are assigned to counties based on primary practice location. County populations were adjusted for age and gender according to primary care use rates described in data from the Medical Expenditure Panel Survey. The raw (unadjusted) population data was from the NC Office of State Budget and Management. The methods are substantially the same as and are described in more detail in this paper: Zolotor AJ, Galloway E, Beal M & Fraher EP. (2022) Primary Care Clinicians in Low-Access Counties. North Carolina Medical Journal, 83(3), 163-68.
-
Galloway E. (2024) Is Access to Primary Care Clinicians Improving In North Carolina? NC Health Workforce: Research Blog. ↩︎
-
Spero JC & Galloway EM. (2019) Running the Numbers. North Carolina Medical Journal, 80(3), 186-190. ↩︎
-
Zolotor AJ, Galloway E, Beal M & Fraher EP. (2022) Primary Care Clinicians in Low-Access Counties. North Carolina Medical Journal, 83(3), 163-68. ↩︎