How Did Hurricane Helene Impact the Health Workforce in North Carolina?
By Brianna Lombardi, Monica Jimenez, Erin Fraher
Sep 11, 2026
In September 2024, Hurricane Helene caused significant damage across many counties in western North Carolina (NC), and the Federal Emergency Management Agency (FEMA) designated disaster areas in 28 NC counties. In a previous blog post, we examined the size and composition of the health workforce in these counties prior to Hurricane Helene (2023) to provide a benchmark from which to monitor changes in access to health professionals in communities impacted by the storm. This analysis uses licensure data from 21 health professions in the NC Health Professions Data System (HPDS) to examine changes in health workforce supply relative to population in the 28 disaster counties compared with the state’s 72 non-disaster counties, one year before the storm in 2023 compared to one year after the hurricane in 2025.
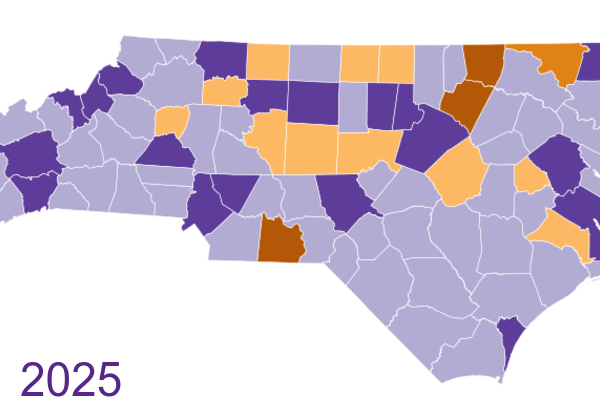
Figure 1. Federal Emergency Management Agency Designated Disaster Counties: Hurricane Helene, North Carolina

28 FEMA-Designated NC Disaster Counties
The 28 FEMA-designated NC disaster counties include: Alexander, Alleghany, Ashe, Avery, Buncombe, Burke, Caldwell, Catawba, Cherokee, Clay, Cleveland, Gaston, Graham, Haywood, Henderson, Jackson, Lincoln, Macon, Madison, McDowell, Mitchell, Polk, Rutherford, Swain, Transylvania, Watauga, Wilkes, and YanceyHow did health workforce supply relative to population change in hurricane-impacted NC counties vs. non-impacted counties?
- Total health workforce supply for the 21 health professions in disaster counties grew from 206.1 health professionals per 10K population in 2023 to 214.3 in 2025, an increase of 4.0%. In non-disaster counties, workforce supply per 10K population increased from 225.1 to 237.9, a 5.7% increase for the same professions (Table 1).
- Disaster counties had lower health workforce supply relative to the population compared to non-disaster counties prior to Hurricane Helene (206.1 vs. 225.1 per 10K population in 2023), and the gap widened after the hurricane (214.3 vs. 237.9 per 10k population in 2025).
- Twelve of the 21 health occupations saw an increase in their supply per 10K population in disaster counties between 2023 and 2025, compared to 19 professions that grew in non-disaster counties. Podiatrists, respiratory therapists, psychologists, licensed practical nurses, occupational therapy assistants, psychological associates, and optometrists all increased their supply per 10K population in non-disaster counties but decreased or remained at the same level in disaster counties. Only certified registered nurse anesthetists and certified nurse specialists decreased in supply in both disaster and non-disaster counties after Hurricane Helene.
- In both disaster and non-disaster counties, nurse practitioners and physician assistants were among the fastest growing professions between 2023 and 2025. Occupational therapists also grew rapidly, increasing slightly faster in disaster counties compared to non-disaster counties (9.4% vs. 9.0%). By contrast, certified nurse midwives increased 9.1% in disaster counties compared to 17.3% in non-disaster counties after the hurricane.
- The physician rate in disaster counties rose slightly from 21.8 per 10K population in 2023 to 22.2 in 2025, an increase of 2.2%. In non-disaster counties, physicians grew twice as fast, increasing from 26.5 physicians per 10K pop in 2023 to 27.7 in 2025, a 4.7% increase.
- Nurse practitioners grew 12.4% in disaster counties versus 15.3% in non-disaster counties, and physician assistants grew 10.2% versus 12.8%.
- Eight professions had a lower rate per 10K population in disaster counties in 2025 than in 2023: certified nurse specialists (-13.3%), optometrists (-6.4%), psychological associates (-4.2%), occupational therapy assistants (-3.8%), licensed practical nurses (-3.3%), certified registered nurse anesthetists (-3.2%), psychologists (-1.6%), and respiratory therapists (-1.4%).
- Registered nurses, the largest workforce in the state, increased slightly faster in non-disaster counties (6.7%) compared to disaster counties (5.9%).
Table 1. Ratio per 10,000 population by occupation in 28 disaster counties and 72 non-disaster counties, 2023 and 2025
| Disaster Counties (n=28) | Non-Disaster Counties (n=72) | |||||
|---|---|---|---|---|---|---|
| Occupation | 2023 | 2025 | % Change | 2023 | 2025 | % Change |
| Certified Nurse Midwife | 0.44 | 0.48 | 9.1% | 0.38 | 0.45 | 17.3% |
| Certified Nurse Specialists | 0.15 | 0.13 | -13.3% | 0.26 | 0.25 | -4.1% |
| Certified Registered Nurse Anesthetists | 2.79 | 2.70 | -3.2% | 2.92 | 2.88 | -1.2% |
| Chiropractor | 2.42 | 2.44 | 0.8% | 1.96 | 1.98 | 1.0% |
| Dental Hygienist | 6.56 | 6.59 | 0.5% | 6.03 | 6.04 | 0.2% |
| Dentist | 4.73 | 4.75 | 0.4% | 5.88 | 6.04 | 2.6% |
| Licensed Practical Nurse | 15.27 | 14.76 | -3.3% | 16.16 | 16.24 | 0.5% |
| Nurse Practitioner | 11.24 | 12.63 | 12.4% | 11.75 | 13.55 | 15.3% |
| Occupational Therapist | 4.38 | 4.79 | 9.4% | 4.29 | 4.68 | 9.0% |
| Occupational Therapy Assistant | 2.65 | 2.55 | -3.8% | 1.80 | 1.82 | 1.2% |
| Optometrist | 1.10 | 1.03 | -6.4% | 1.22 | 1.24 | 1.8% |
| Pharmacist | 9.36 | 9.42 | 0.6% | 11.44 | 11.63 | 1.6% |
| Physical Therapist | 8.04 | 8.25 | 2.6% | 8.08 | 8.62 | 6.6% |
| Physical Therapist Assistant | 4.86 | 4.89 | 0.6% | 2.96 | 3.01 | 1.6% |
| Physician | 21.77 | 22.24 | 2.2% | 26.48 | 27.72 | 4.7% |
| Physician Assistant | 6.17 | 6.80 | 10.2% | 8.35 | 9.42 | 12.8% |
| Podiatrist | 0.30 | 0.30 | 0.0% | 0.33 | 0.33 | 1.1% |
| Psychological Associate | 0.71 | 0.68 | -4.2% | 0.66 | 0.67 | 2.1% |
| Psychologist | 1.87 | 1.84 | -1.6% | 2.31 | 2.34 | 1.3% |
| Registered Nurse | 97.61 | 103.41 | 5.9% | 107.35 | 114.57 | 6.7% |
| Respiratory Therapist | 3.65 | 3.60 | -1.4% | 4.46 | 4.47 | 0.3% |
| Total | 206.1 | 214.3 | 4.0% | 225.05 | 237.94 | 5.7% |
How did changes to the health workforce supply in hurricane-impacted counties vary?
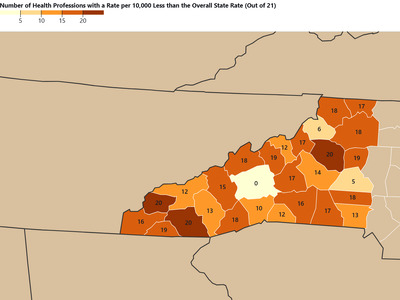
- Changes in health workforce supply per 10K population varied between counties affected by Hurricane Helene. This variation was due to differences between counties in how their supply of health professionals and population changed between 2023 and 2025. Four of the 28 counties (Ashe, Mitchell, Swain, and Watauga) in the hurricane region lost population, three of which had an increase in workforce supply and one (Mitchell) had a decrease in health workforce supply.
- Fourteen of the 28 counties had a growth in health workforce supply that outpaced the state average growth. Counties with the greatest increase in health workforce supply relative to population from 2023 to 2025 were Swain (14.1%), Lincoln (11.9%), Graham (11.4%), Ashe (10.7%), and Rutherford (10.7%) counties.
- Eight of the 28 counties’ health workforce supply grew between 2023 and 2025, but this growth was lower than the state average.
- Six of the 28 counties’ health workforce supply declined relative to population between 2023 and 2025: Cherokee (-5.9%), Alexander (-5.7%), Polk (-4.7%), Mitchell (-3.3%), Avery (-1.3%), and Buncombe (-1.0%).
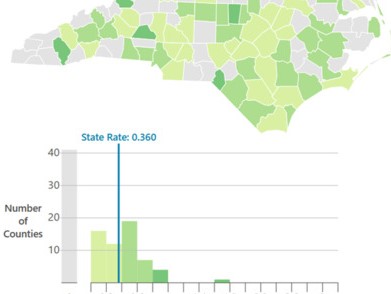
- Despite a 1% decline in workforce supply per 10k population between 2023 and 2025, Buncombe County had the hurricane region’s largest health workforce, with 10,178 health professionals and a rate of 359.6 per 10K population in 2025, well above the state rate of 234.3 per 10K population.
Figure 2. Change in health workforce supply per 10,000 population in Hurricane Helene disaster counties compared with the state rate, 2023 to 2025

Did health professionals leave the region after Hurricane Helene?
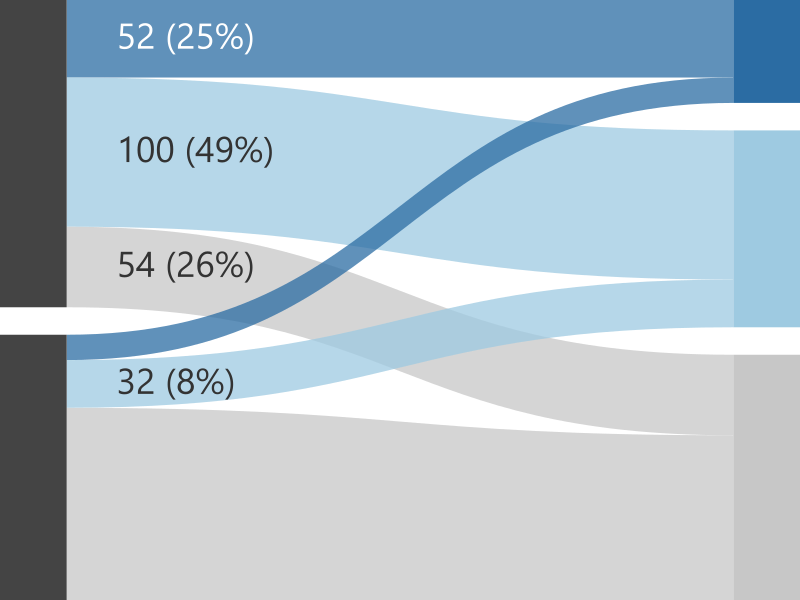
Thus far, this blog has analyzed aggregate changes in the health workforce after Hurricane Helene. Of the 37,284 health professionals who were in active practice in the 28 disaster counties in 2023:
- 30,327 (81.3%) were still active in disaster counties in 2025
- 1,914 (5.1%) remained active in NC but were practicing in a non-disaster county in 2025
- 5,043 (13.5%) were not in active practice in NC in 2025. This group includes health professionals that were inactive, retired, no longer licensed, or had left the state.
Table 2. Practice Status in 2025 for health professionals active in disaster counties in 2023 (n=37,284)
| Status | N | % |
|---|---|---|
| Active in disaster counties, 2023 and 2025 | 30,327 | 81.3% |
| Active in disaster counties 2023; active in non-disaster counties 2025 | 1,914 | 5.1% |
| Active in disaster counties 2023; inactive in NC 2025 | 5,043 | 13.5% |
Note. Inactive includes health professionals that are retired, not in the file, or left the state.
Figure 3. Practice Status in 2025 among health professionals active in disaster counties in 2023 (n=37,284)

Note. Includes all 21 health occupations in the analysis. Inactive includes health professionals that are retired, not in the file, or left the state. Figure data can be accessed here.
What do these findings mean for the region?
One year after Hurricane Helene, the health workforce in disaster counties continued to grow relative to population, and most healthcare workers who were in the region before the storm remained working in the region. However, overall growth of the health workforce in the disaster region lagged compared to non-disaster counties, widening a workforce gap that predated the hurricane. Several professions, particularly licensed practical nurses, occupational therapy assistants, optometrists, and psychologists, have declined in the region while remaining at the same levels or growing elsewhere in NC. Continued monitoring of these professions, and of the counties where declines are concentrated, will be important as the region’s recovery continues.