North Carolina's LPN Workforce Faces a Double Challenge: Declining Supply and Fewer Nurses in Long-Term Care
By Erin P. Fraher PhD MPP, Julie C. Spero MSPH, and Monica P. Jimenez PhD
Nov 6, 2026
Introduction
North Carolina is expected to face a shortage of more than 5,000 licensed practical nurses (LPNs) by 2033 with all regions of the state facing shortfalls. Nursing home, extended care, and assisted living facilities will be greatly affected, with LPN job openings projected to outnumber available LPNs by two to one.
LPNs provide patient care under the supervision of a registered nurse (RN) or other qualified healthcare clinician. Their role may include discussing health concerns with patients, reporting concerns to supervising clinicians, monitoring vital signs, changing bandages, assisting with bathing and dressing, recording patient status and the care provided, maintaining health records, etc. LPNs work in a variety of healthcare settings, with the largest portion working in long-term care (LTC) settings.
Shortages of registered nurses in the wake of the COVID-19 pandemic have caused healthcare organizations to explore new staffing models. A 2025 analysis found a significant increase in the LPN employment in hospitals in recent years. If this trend continues, it will likely affect the availability of the LPNs to practice in LTC settings, which face increased demand due to NC’s aging population. This will in turn affect hospitals that may struggle to discharge patients requiring care in LTC settings.
Addressing LPN shortages requires a multi-tiered approach. Strategies include increasing the number of graduates from LPN programs in the state, retaining existing LPNs in the workforce, and reengaging LPNs who have left practice. This report examines where North Carolina’s LPN workforce is growing, where it is declining, and what these trends mean for employers, educators, workforce planners, and policymakers seeking to ensure adequate staffing across the continuum of care.
The LPN Workforce Has Rebounded in Recent Years But Remains Smaller than a Decade Ago
Figure 1. Licensed Practical Nurses in Active Practice, North Carolina, 2016-2025
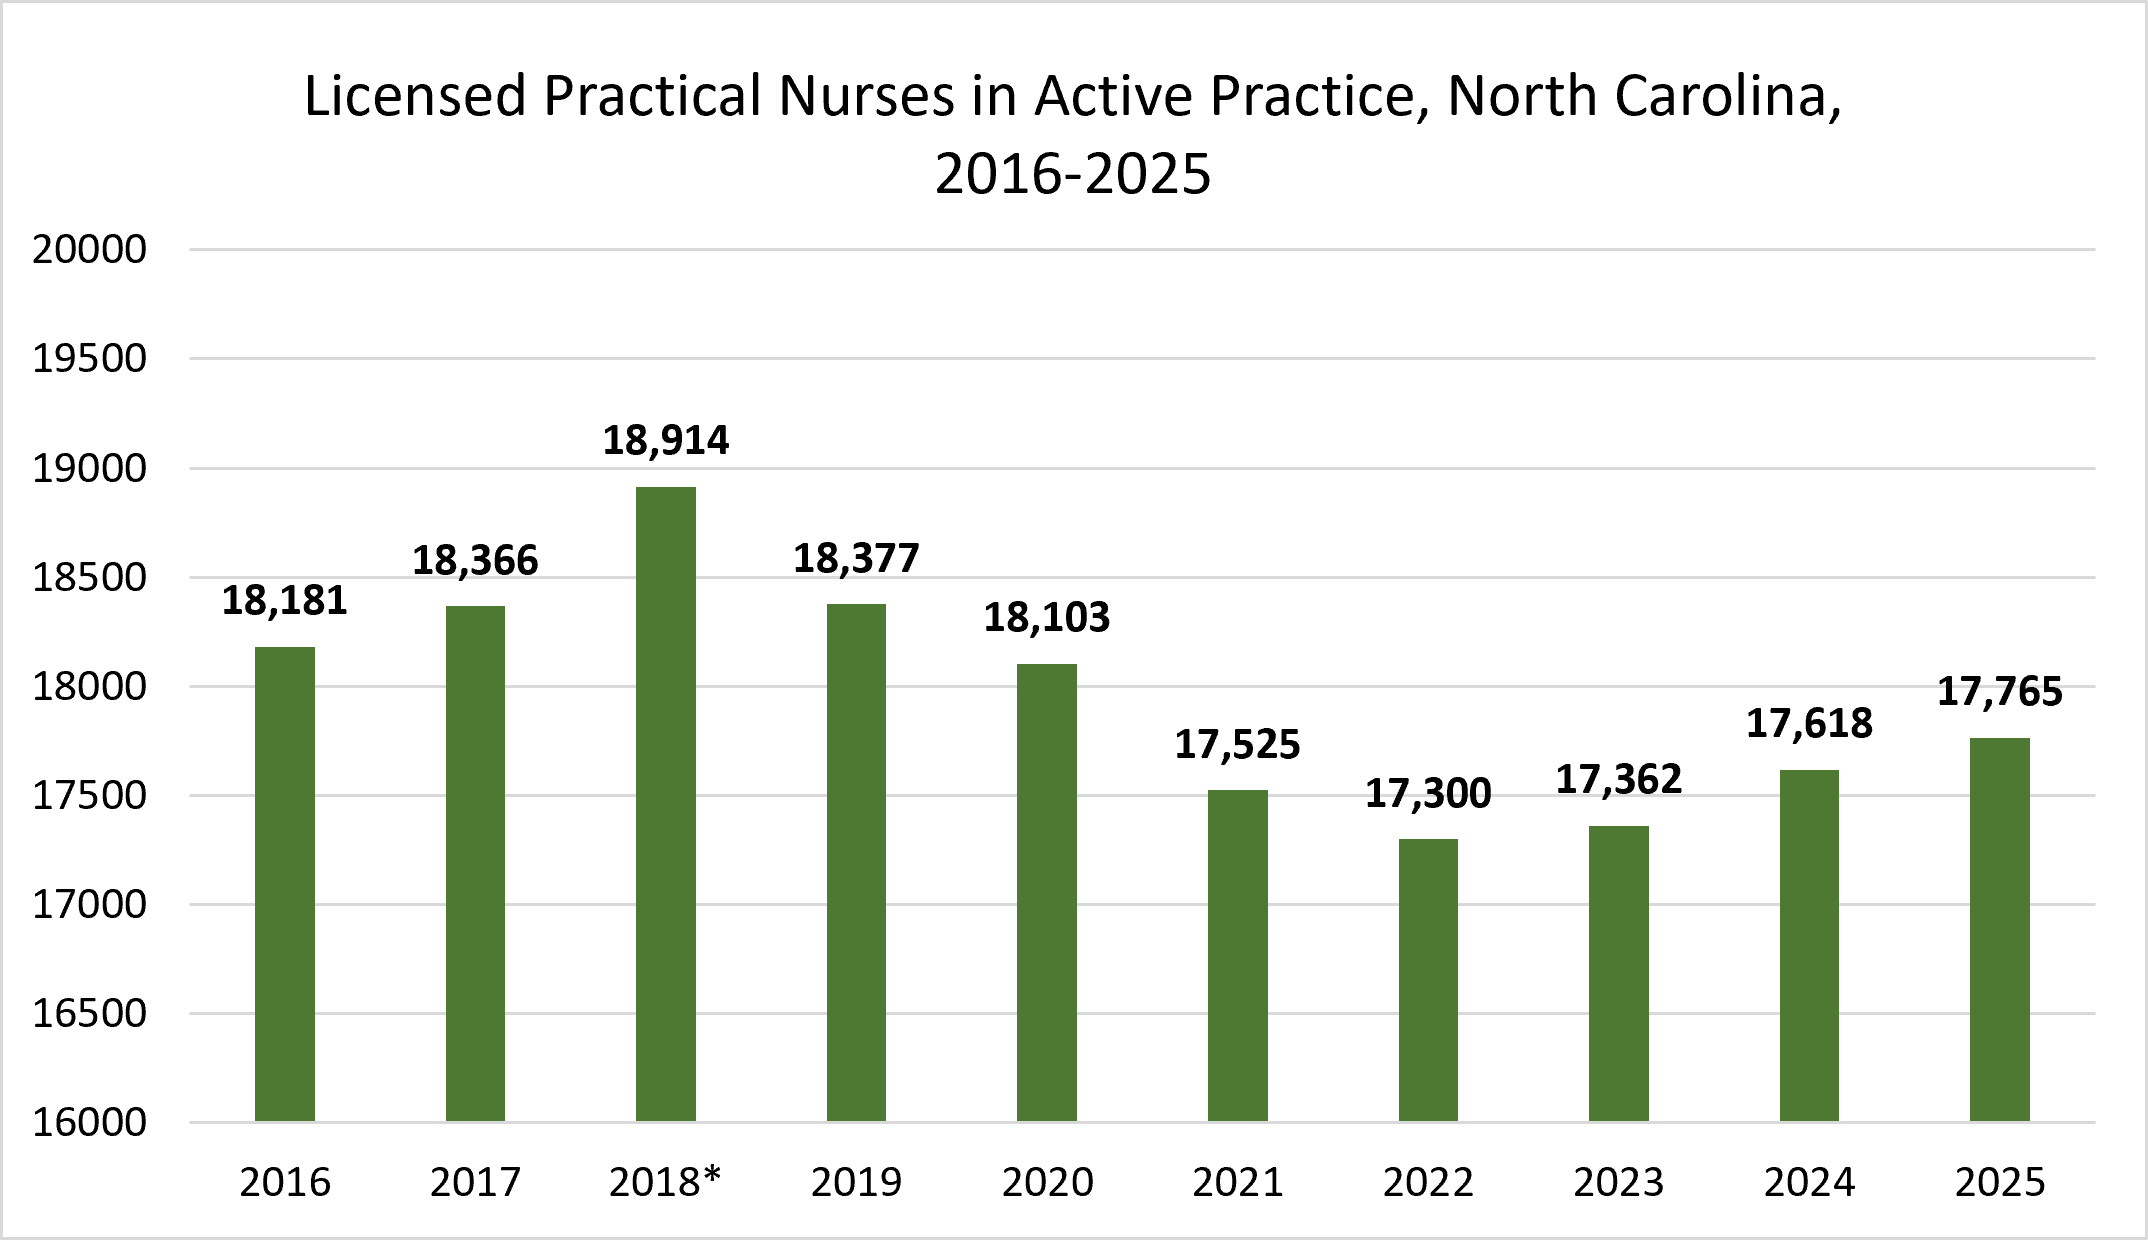
Note: Data include active LPNs in practice in North Carolina as of October 31 of each year.
Source: NC Health Professions Data System with data derived from the North Carolina Board of Nursing.
Relative to population, the LPN workforce has declined over the past decade, from 18 LPNs per 10,000 population in 2016 to 16 LPNs per 10,000 in 2025. The recent growth in the LPN workforce since 2023 has remained steady, keeping pace with NC’s population growth.
Figure 2. LPNs per 10,000 Population in Active Practice, North Carolina, 2016-2025
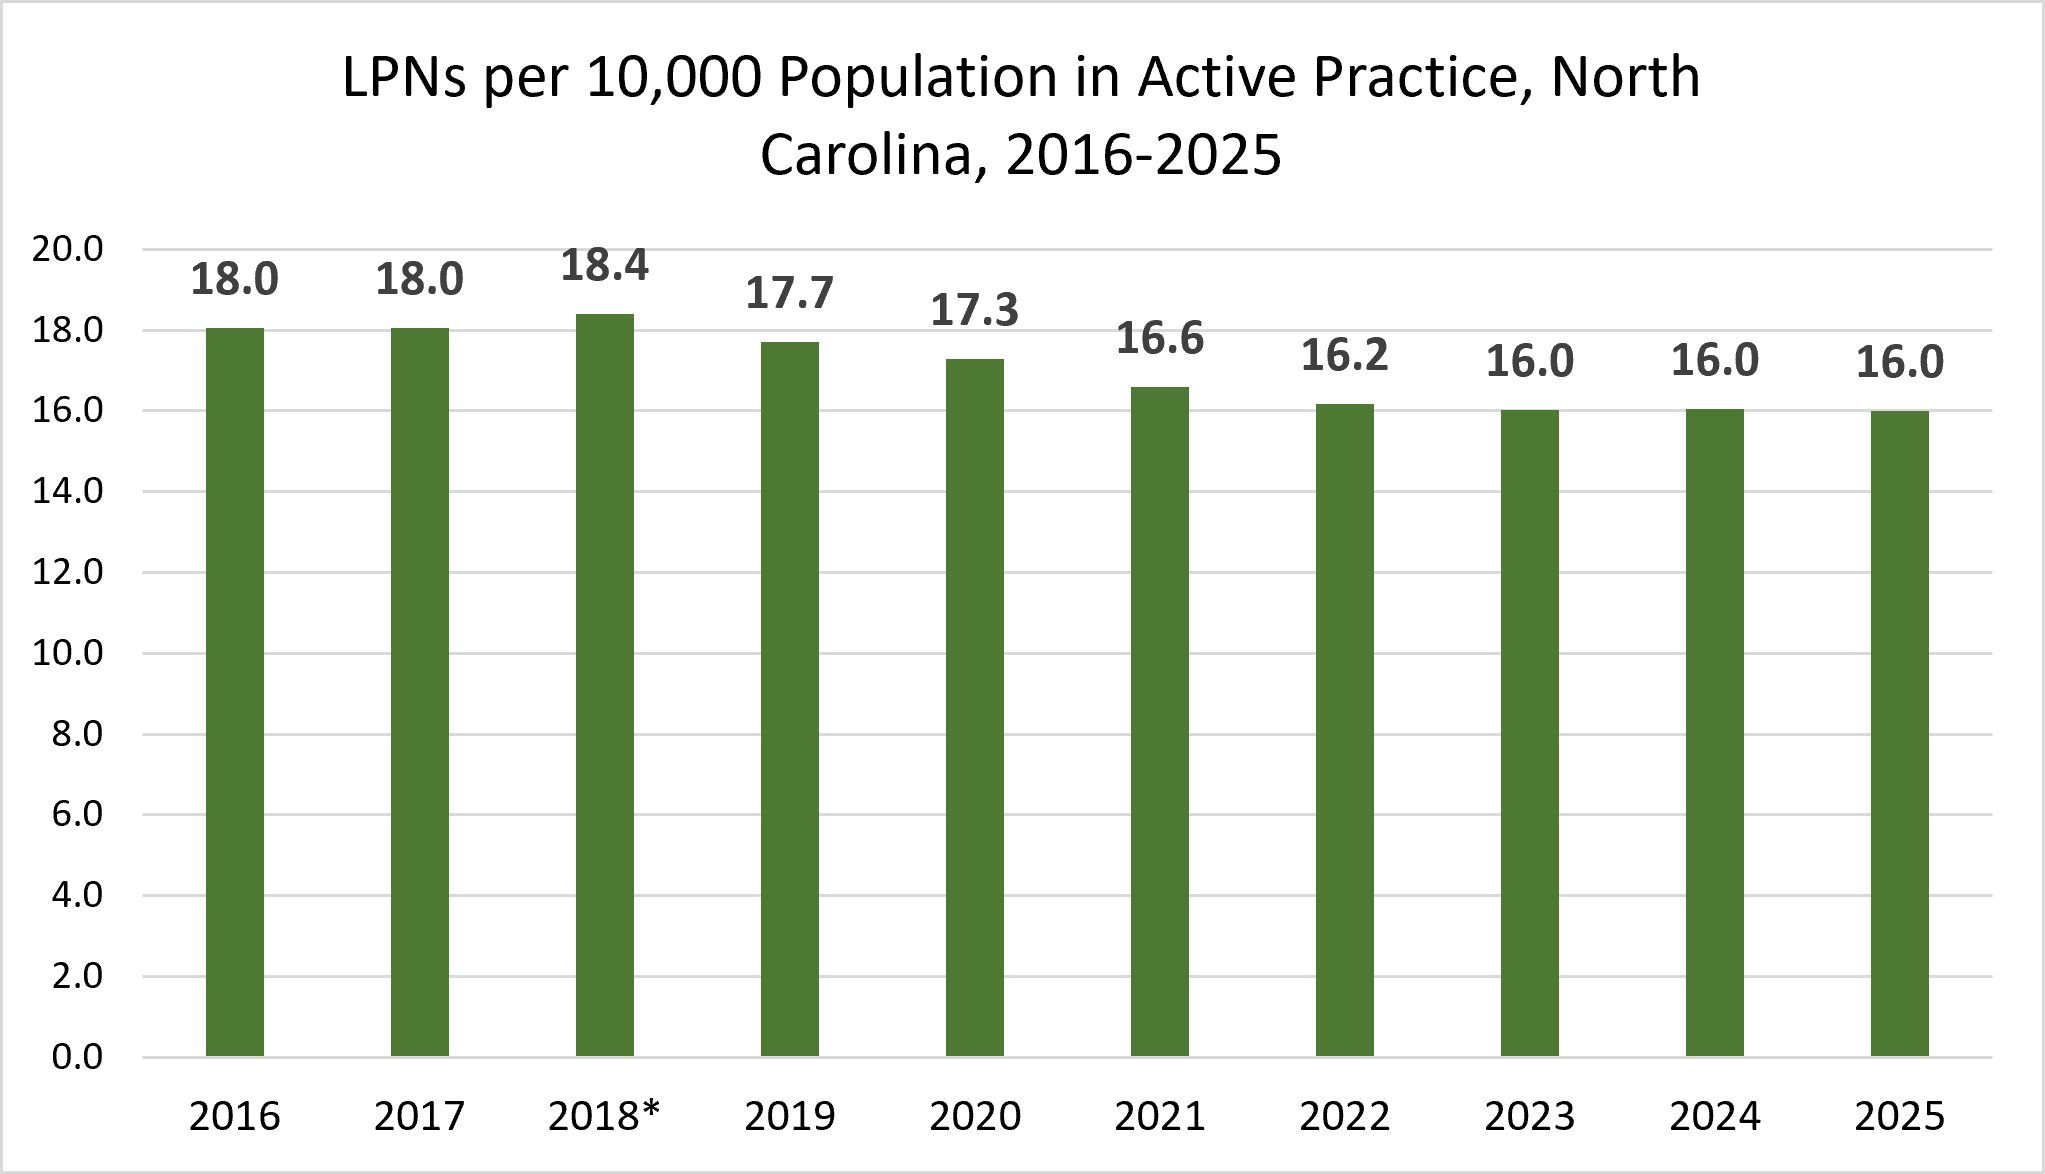
Note: Data include active, LPNs in practice in North Carolina as of October 31 of each year.
Source: NC Health Professions Data System with data derived from the North Carolina Board of Nursing. Population census data and estimates are downloaded from the North Carolina Office of State Budget and Management via NC LINC and are based on US Census data.
Rural Counties Continue to Have More LPNs Per Capita, but the Gap Is Narrowing
North Carolina’s health workforce is concentrated in metropolitan (urban) areas. However, the LPN workforce is an exception. The supply of LPNs has historically been higher in rural (non-metropolitan) counties compared to urban counties (Figure 3). The gap has been narrowing over time, particularly after the pandemic years. In 2025, there were 16.9 LPNs per 10,000 population in rural counties, relative to 15.8 per 10,000 population in urban counties.
Figure 3. LPNs per 10,000 Population in Active Practice in Metropolitan and Non-Metropolitan (Rural) Counties, North Carolina, 2016-2025
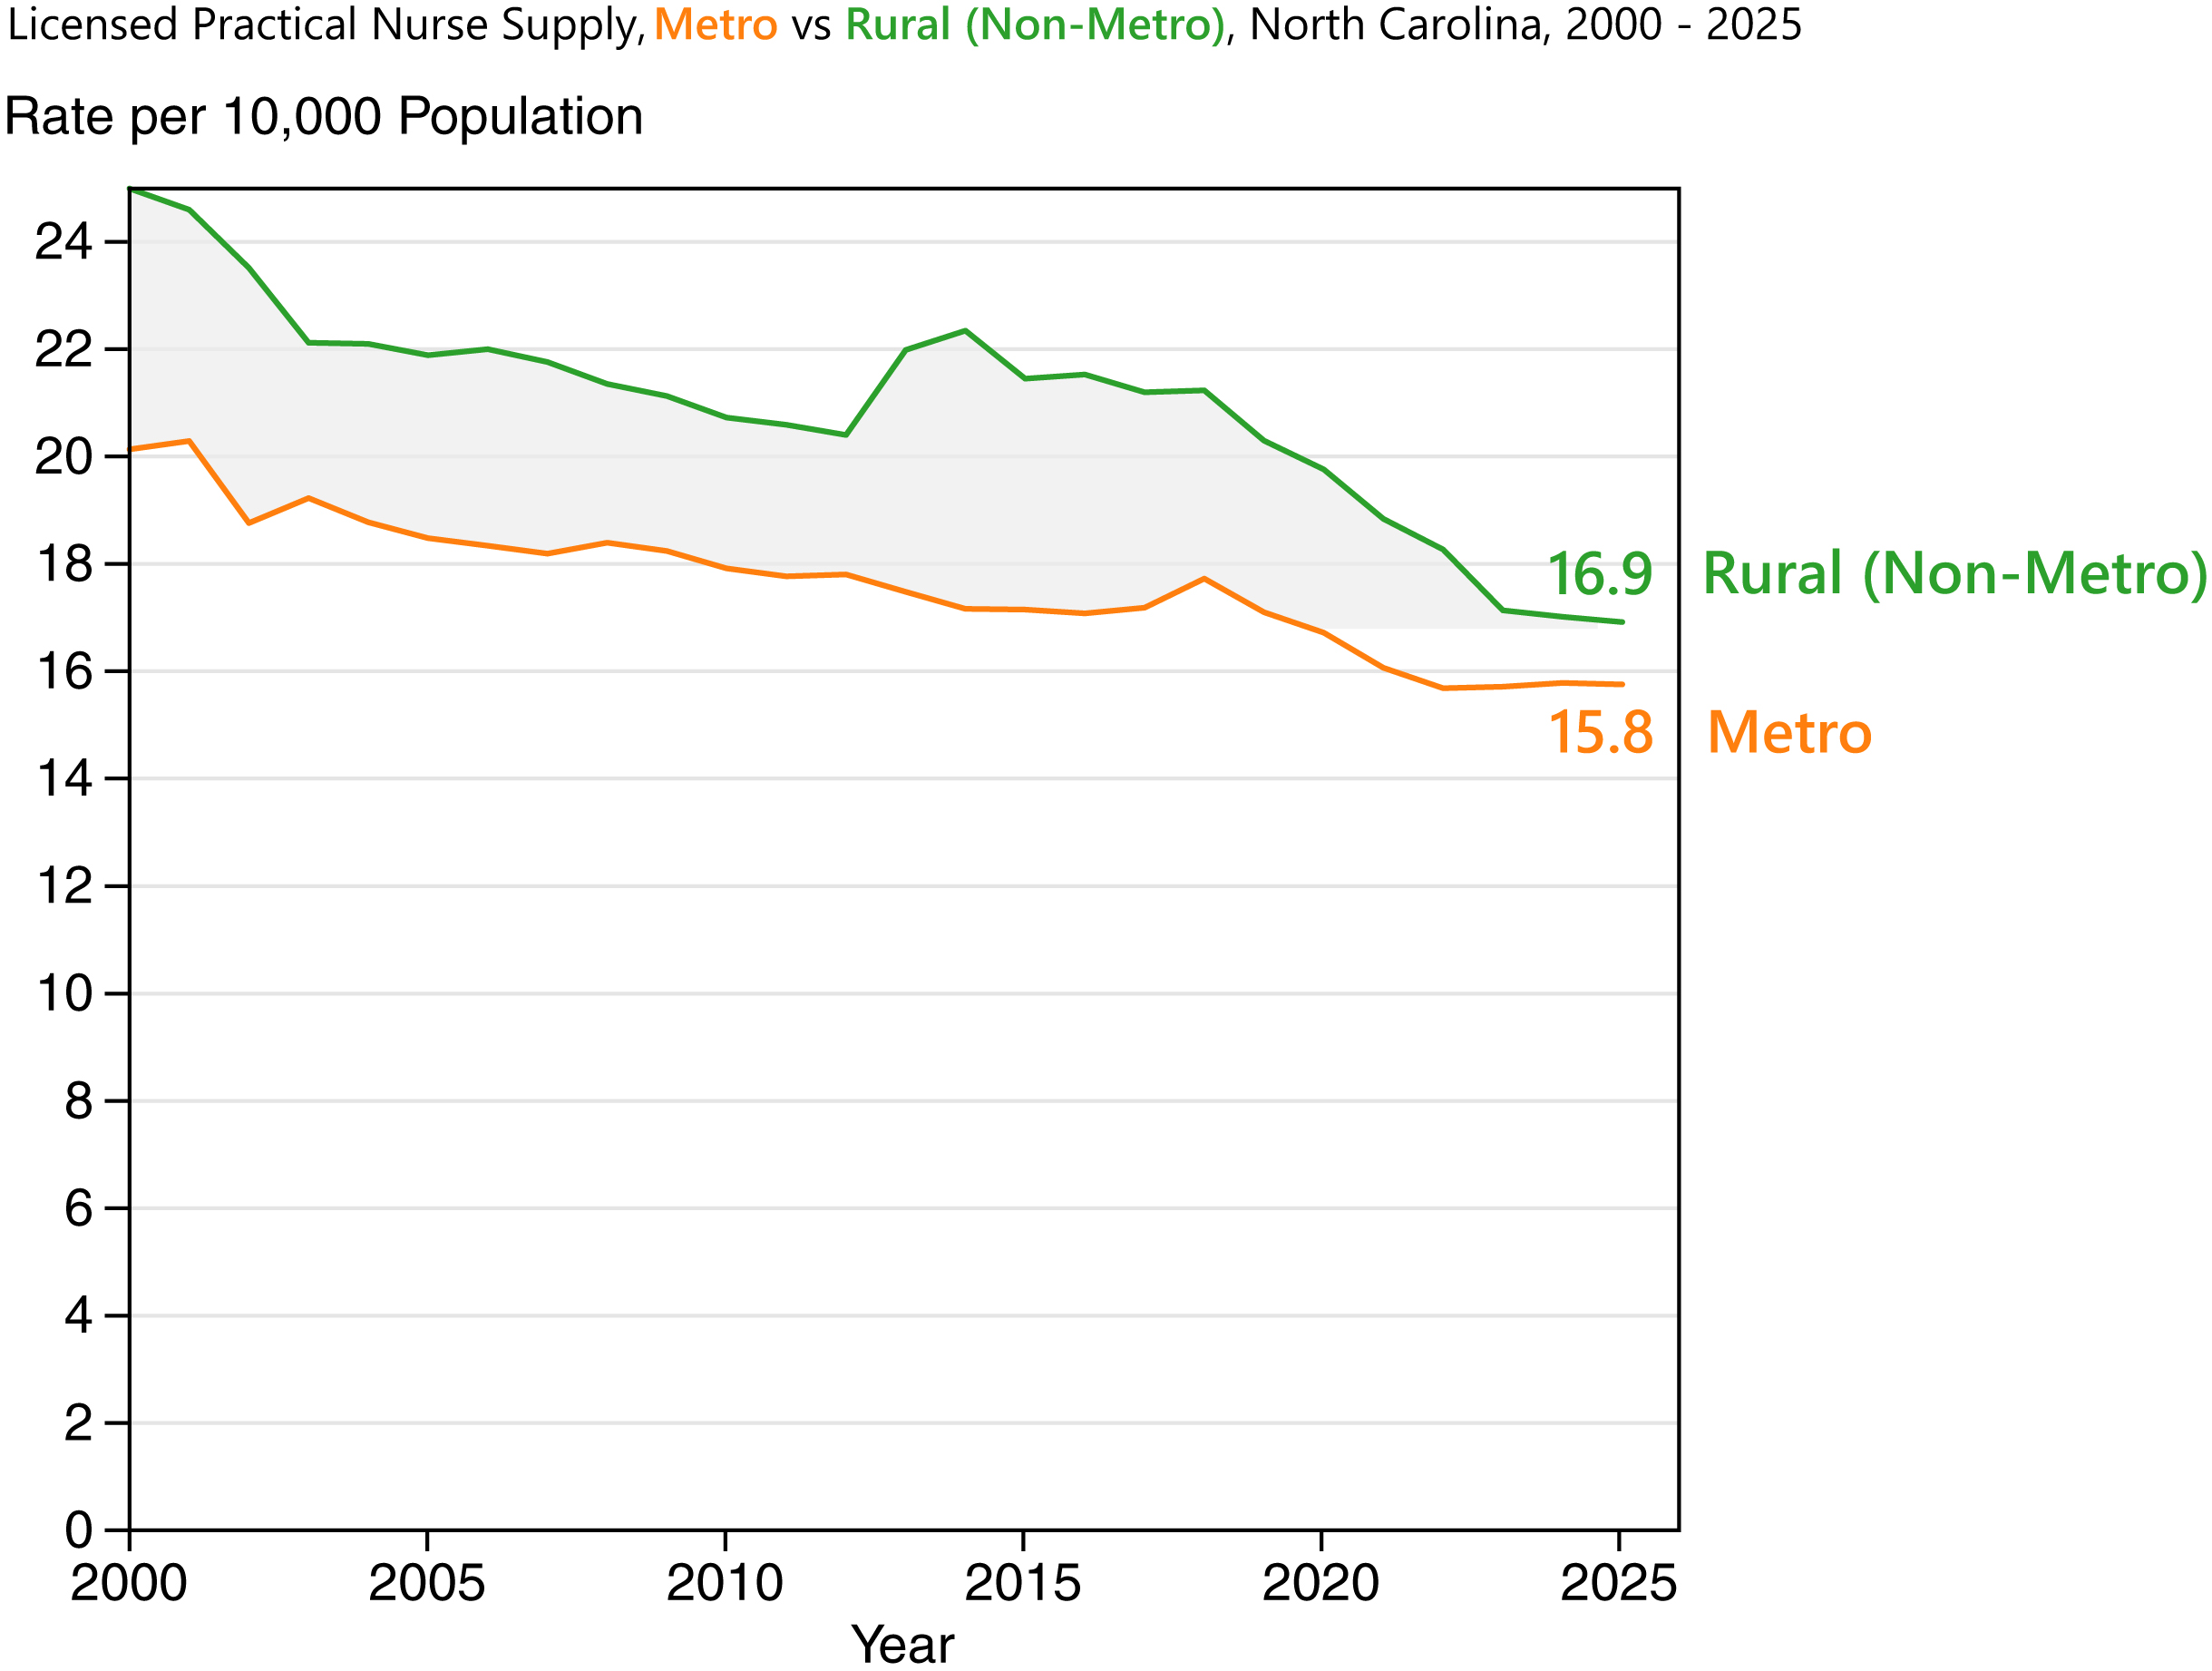
Note: Data include active, licensed LPNs in practice in North Carolina as of October 31 of each year. Source: NC Health Professions Data System with data derived from the North Carolina Board of Nursing. Population census data and estimates are downloaded from the North Carolina Office of State Budget and Management and are based on US Census data. Metropolitan or rural (non-metropolitan) county status was defined using US Office of Management and Budget Core Based Statistical Areas (CBSAs). Non-metropolitan counties include micropolitan counties and non-CBSAs. The vintage or year of the delineation file used to aggregate the counties corresponds with the delineations in place for each year of data. That is, the counties defined as non-metropolitan in 2000 are different than the non-metropolitan ones in 2025.
One in Three LPNs Work in Long-Term Care Settings
Approximately one-third of NC’s LPN workforce report a primary employment setting in a nursing home, extended care, or assisted living facility (Table 1). However, the percentage of LPNs working in those settings decreased over the past decade, from 36.3% (n=6,605) in 2016 to 31.0% (n=5,508). In 2025, 15.2% (n=2,703) of LPNs worked in home health or hospice settings, 9.9% (n=1,761) worked in ambulatory care settings, and 8.6% (n=1,525) worked in hospital settings. Most LPNs with missing employment setting data were newly licensed at the time of data collection and had not yet begun working.
The second most common employment setting for LPNs (21.9% in 2025, n=3,897) in 2025 was “other settings.” In this analysis, “other settings” includes correctional facilities, public health settings, occupational health settings, insurance claims & benefits, academic settings, school health service, community health settings, dialysis centers, mental health, and other settings.
Table 1. LPNs by Employment Setting, North Carolina, 2016-2025
| Employment Setting by Year, n (%) | 2016 | 2017 | 2018 | 2019 | 2020 | 2021 | 2022 | 2023 | 2024 | 2025 |
|---|---|---|---|---|---|---|---|---|---|---|
| Hospital | 1,262 (6.9) | 1,169 (6.4) | 1,054 (5.6) | 1,087 (5.9) | 1,133 (6.3) | 1,099 (6.3) | 1,142 (6.6) | 1,281 (7.4) | 1,408 (8.0) | 1,525 (8.6) |
| Ambulatory Care | 1,442 (7.9) | 1,728 (9.4) | 1,792 (9.5) | 1,952 (10.6) | 2,054 (11.3) | 1,860 (10.6) | 1,691 (9.8) | 1,717 (9.9) | 1,744 (9.9) | 1,761 (9.9) |
| Nursing Home/Extended Care/Assisted Living | 6,605 (36.3) | 6,641 (36.2) | 6,249 (33.0) | 6,265 (34.1) | 6,071 (33.5) | 5,716 (32.6) | 5,491 (31.7) | 5,496 (31.7) | 5,596 (31.8) | 5,508 (31.0) |
| Home Health/Hospice | 2,178 (12.0) | 2,383 (13.0) | 2,425 (12.8) | 2,639 (14.4) | 2,568 (14.2) | 2,591 (14.8) | 2,634 (15.2) | 2,630 (15.1) | 2,674 (15.2) | 2,703 (15.2) |
| Other Settings | 4,915 (27.0) | 4,800 (26.1) | 4,375 (23.1) | 4,302 (23.4) | 4,297 (23.7) | 4,255 (24.3) | 4,254 (24.6) | 4,168 (24.0) | 4,036 (22.9) | 3,897 (21.9) |
| Missing Setting | 1,779 (9.8) | 1,645 (9.0) | 3,019 (16.0) | 2,132 (11.6) | 1,980 (10.9) | 2,004 (11.4) | 2,088 (12.1) | 2,070 (11.9) | 2,160 (12.3) | 2,371 (13.3) |
| Total | 18,181 | 18,366 | 18,914 | 18,377 | 18,103 | 17,525 | 17,300 | 17,362 | 17,618 | 17,765 |
Note: Data include active LPNs in practice in North Carolina as of October 31 of each year.
Source: NC Health Professions Data System with data derived from the North Carolina Board of Nursing.
The Pandemic Accelerated Shifts in LPN Employment Settings
LPN employment trends shifted during the pandemic (Table 2). The number of LPNs in nursing home, extended care, and assisted living facilities fell by 1,097 LPNs (16.6%) between 2016 and 2025. More than half of this decline occurred between 2020 and 2022 when employment decreased by 580 LPNs (-9.6%).
The number of LPNs working in hospital settings declined between 2016 and 2020 (n=-129; -10.2%) but after the peak of the pandemic between 2022 and 2025, hospital-employed LPNs grew by 33.5% (n=+383). LPN employment in ambulatory care grew prior to the pandemic by 42.4% (n=+612), however, that growth dropped off sharply (-17.7%; n=-363) during the pandemic years and then increased modestly between 2022 and 2025 (4.1%; n=+70). LPN employment in home health care and hospice settings increased from 2016 until 2020 by 390 LPNs (17.9%) but that growth has also slowed since 2020.
Table 2. Changes in the Number of Active-Practice North Carolina LPNs by Primary Employment Setting Before, During, and After the COVID-19 Pandemic
| Pre-Pandemic 2016-2020 Δn (%Δ) | Pandemic 2020-2022 Δn (%Δ) | Post-Pandemic 2022-2025 Δn (%Δ) | Total Period 2016-2025 Δn (%Δ) | |
|---|---|---|---|---|
| Hospital | -129 (-10.2%) | +9 (+0.8%) | +383 (+33.5%) | +263 (+20.8%) |
| Ambulatory Care Setting | +612 (+42.4%) | -363 (-17.7%) | +70 (+4.1%) | +319 (+22.1%) |
| Nursing Home/Extended Care/Assisted Living | -534 (-8.1%) | -580 (-9.6%) | +17 (+0.3%) | -1,097 (-16.6%) |
| Home Health/Hospice | +390 (+17.9%) | +66 (+2.6%) | +69 (+2.6%) | +525 (+24.1%) |
| Other Settings | -618 (-12.6%) | -43 (-1.0%) | -357 (-8.4%) | -1,018 (-20.7%) |
| Missing Setting | +201 (+11.3%) | +108 (+5.5%) | +283 (+13.6%) | +592 (+33.3%) |
| Total | -78 (-0.4%) | -803 (-4.4%) | +465 (+2.7%) | -416 (-2.3%) |
Note: Data include active LPNs in practice in North Carolina as of October 31 of each year.
Source: NC Health Professions Data System with data derived from the North Carolina Board of Nursing.
LPN Employment in Long-Term Care Settings Has Declined, Especially in Rural Counties
Changes in LPN employment differed substantially between urban and rural counties, particularly in LTC settings. (Table 3). Over the past decade, LPN employment in nursing home, extended care, and assisted living settings fell by 29.5% (n=-515) in rural counties compared with a decline of 12.0% (n=-582) in urban counties. By contrast, hospital employment increased at similar rates in urban and rural counties, growing 21.0% (n=+202) and 20.5% (n=+61), respectively. Similarly, employment in ambulatory care settings increased by 22.0% (n=+263) in urban counties and 22.8% (n=+56) in rural counties. Overall, the number of active-practice LPNs increased 2.9% (n=+398) in metropolitan counties while declining 17.7% (n=-814) in nonmetropolitan counties.
Table 3. Change in LPN Employment Setting by Metropolitan (Urban) and Non-Metropolitan (Rural) Status, 2016-2025
| Metropolitan Counties | Non-Metropolitan Counties | |||||
|---|---|---|---|---|---|---|
| Primary Employment Setting | 2016 (n) | 2025 (n) | Metro Δn (%Δ) | 2016 (n) | 2025 (n) | Nonmetro Δn (%Δ) |
| Hospital | 964 | 1,166 | +202 (+21.0%) | 298 | 359 | +61 (+20.5%) |
| Ambulatory Care | 1,196 | 1,459 | +263 (+22.0%) | 246 | 302 | +56 (+22.8%) |
| Nursing Home/Extended Care/Assisted Living | 4,862 | 4,280 | -582 (-12.0%) | 1,743 | 1,228 | -515 (-29.5%) |
| Home Health/Hospice | 1,858 | 2,391 | +533 (+28.7%) | 320 | 312 | -8 (-2.5%) |
| Other Settings | 3,478 | 2,939 | -539 (-15.5%) | 1,437 | 958 | -479 (-33.3%) |
| Total | 13,586 | 13,984 | +398 (+2.9%) | 4,595 | 3,781 | -814 (-17.7%) |
Note: Data include active LPNs in practice in North Carolina as of October 31 of each year.
Source: NC Health Professions Data System with data derived from the North Carolina Board of Nursing.
Enrollment in NC LPN Training Programs is Rising
LPN enrollment increased by 29.5% (n=417 students) between 2023 and 2025. To become licensed to practice as an LPN, students must pass the National Council Licensure Examination for Practical Nurses (NCLEX-PN) after graduation. The increase in LPN enrollment is reflected in the recent increase in first time NCLEX-PN test takers, which was relatively steady between 2016 and 2023 but increased 26% between 2023 and 2025 (Figure 4).
Figure 4. Number of First Time NCLEX-PN Test Takers, North Carolina, 2016-2025
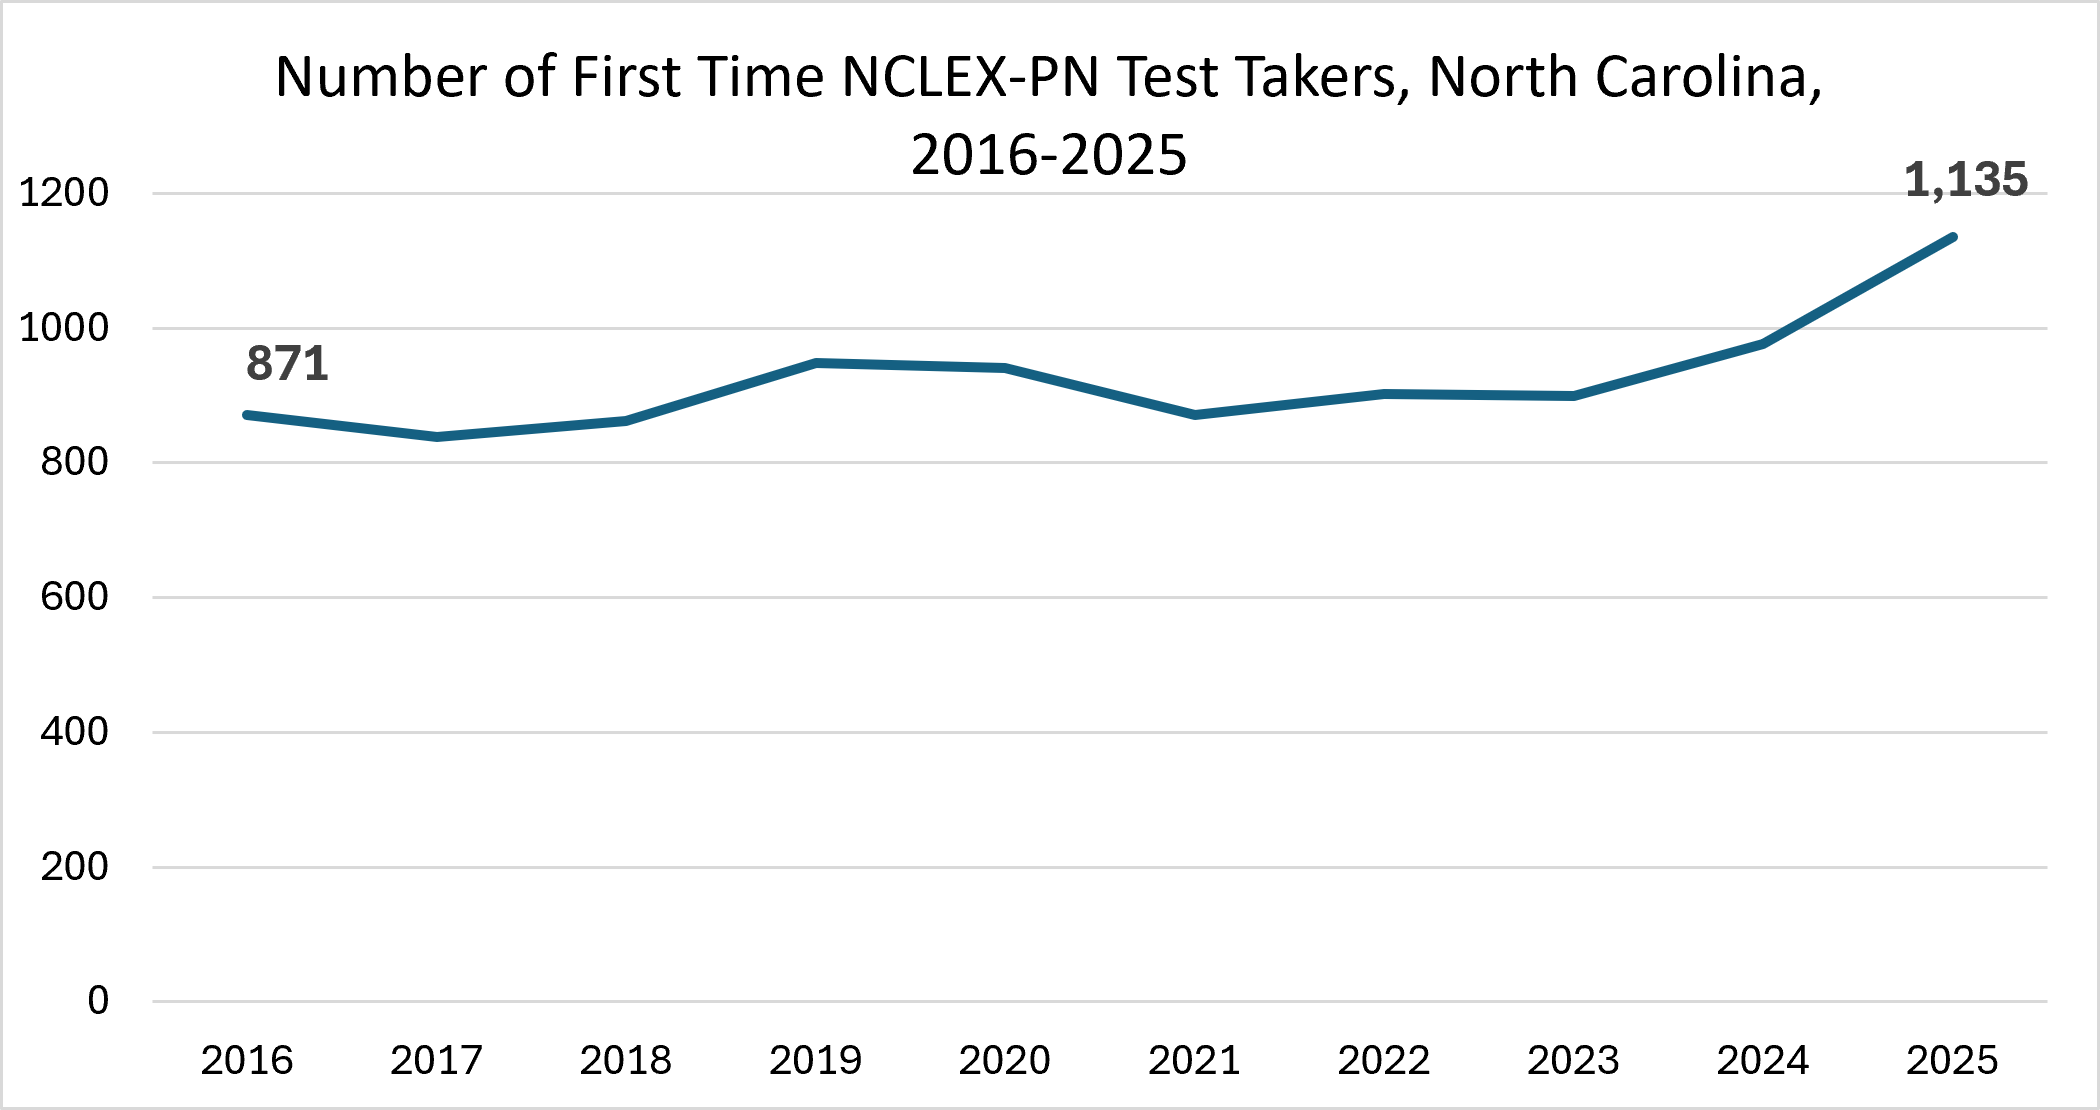
Source: Data from the National Council of State Boards of Nursing (NCSBN), NCLEX® Examination Statistics, Research Briefs Vol. 70 (2017) through Vol. 96 (2026). Available from: https://www.ncsbn.org/exams/exam-statistics-and-publications/nurse-licensure-and-nclex-exam-statistics.page Accessed November 4, 2026.
North Carolina’s NCLEX-PN pass rates consistently exceeded national averages, ranging from 5.6 to 11.3 percentage points higher than US pass rates (Table 4).
Table 4. First Time NCLEX-PN Test Takers, Pass Rates, North Carolina and United States, 2016-2025
| NC Candidates Taking NCLEX-PN | NC Candidates Passing NCLEX-PN | NC Pass Rate | United States Pass Rate | Percentage Point Difference (NC-US) | |
|---|---|---|---|---|---|
| 2016 | 871 | 794 | 91.2% | 83.7% | 7.5 |
| 2017 | 839 | 789 | 94.0% | 83.8% | 10.2 |
| 2018 | 862 | 816 | 94.7% | 85.9% | 8.8 |
| 2019 | 948 | 888 | 93.7% | 85.6% | 8.1 |
| 2020 | 941 | 835 | 88.7% | 83.1% | 5.6 |
| 2021 | 871 | 771 | 88.5% | 79.6% | 8.9 |
| 2022 | 902 | 823 | 91.2% | 79.9% | 11.3 |
| 2023 | 899 | 849 | 94.4% | 86.7% | 7.7 |
| 2024 | 976 | 924 | 94.7% | 88.4% | 6.3 |
| 2025 | 1,135 | 1,080 | 95.2% | 86.6% | 8.6 |
Source: Data from the National Council of State Boards of Nursing (NCSBN), NCLEX® Examination Statistics, Research Briefs Vol. 70 (2017) through Vol. 96 (2026). Available from: https://www.ncsbn.org/exams/exam-statistics-and-publications/nurse-licensure-and-nclex-exam-statistics.page Accessed November 4, 2026.
Newly Licensed NC-Educated LPNs Were More Likely to Work in Hospitals than Were Newly Licensed LPNs from Out-of-State
To determine where newly licensed LPNs are getting jobs, we examined the practice setting of LPNs who were initially licensed in 2023. Not all LPNs in this cohort are recent graduates; some are new to NC and were previously practicing in another state. Of the 1,055 LPNs newly licensed in North Carolina in 2023 and practicing in 2025, 68.2% (n=720) were educated in North Carolina and 31.8% (n=335) were educated outside the state (Table 5). The largest employment setting for newly licensed LPNs was nursing homes, extended care, and assisted living facilities, which employed 35.5% (n=375) of newly licensed LPNs. Hospitals were the second-largest employment setting, employing 20.3% (n=214) of newly licensed LPNs, followed by other settings (18.1%, n=191) and home health and hospice (13.9%, n=147).
Table 5. 2025 Practice Setting of NC LPNs Newly Licensed in NC in 2023, Educated In-State vs. Educated Outside NC
| Primary Employment Setting | Educated in NC n (%) | Educated Out of State n (%) | Total n (%) |
|---|---|---|---|
| Hospital | 182 (25.3) | 32 (9.6) | 214 (20.3) |
| Ambulatory Care | 56 (7.8) | 32 (9.6) | 88 (8.3) |
| Nursing Home/Extended Care/Assisted Living | 236 (32.8) | 139 (41.5) | 375 (35.5) |
| Home Health/Hospice | 100 (13.9) | 47 (14.0) | 147 (13.9) |
| Other Settings | 124 (17.2) | 67 (20.0) | 191 (18.1) |
| Missing Setting | 22 (3.1) | 18 (5.4) | 40 (3.8) |
| Total | 720 (100) | 335 (100) | 1,055 (100) |
Source: NC Health Professions Data System with data derived from the North Carolina Board of Nursing.
Nearly a quarter (25.3%, n=182/720) of NC-educated newly licensed LPNs reported working in a hospital setting, compared to 9.6% (n=32/335) of newly licensed LPNs educated out-of-state. A larger proportion of newly licensed LPNs educated outside North Carolina worked in nursing homes, extended care, and assisted living settings (41.5%, n=139 vs. 32.8%, n=236). Although graduates of North Carolina programs represented 68.2% of newly licensed LPNs overall, they accounted for 85.0% (n=182 of 214) of newly licensed LPNs employed in hospitals.
When LPNs Leave the NC Workforce, Where Do They Go?
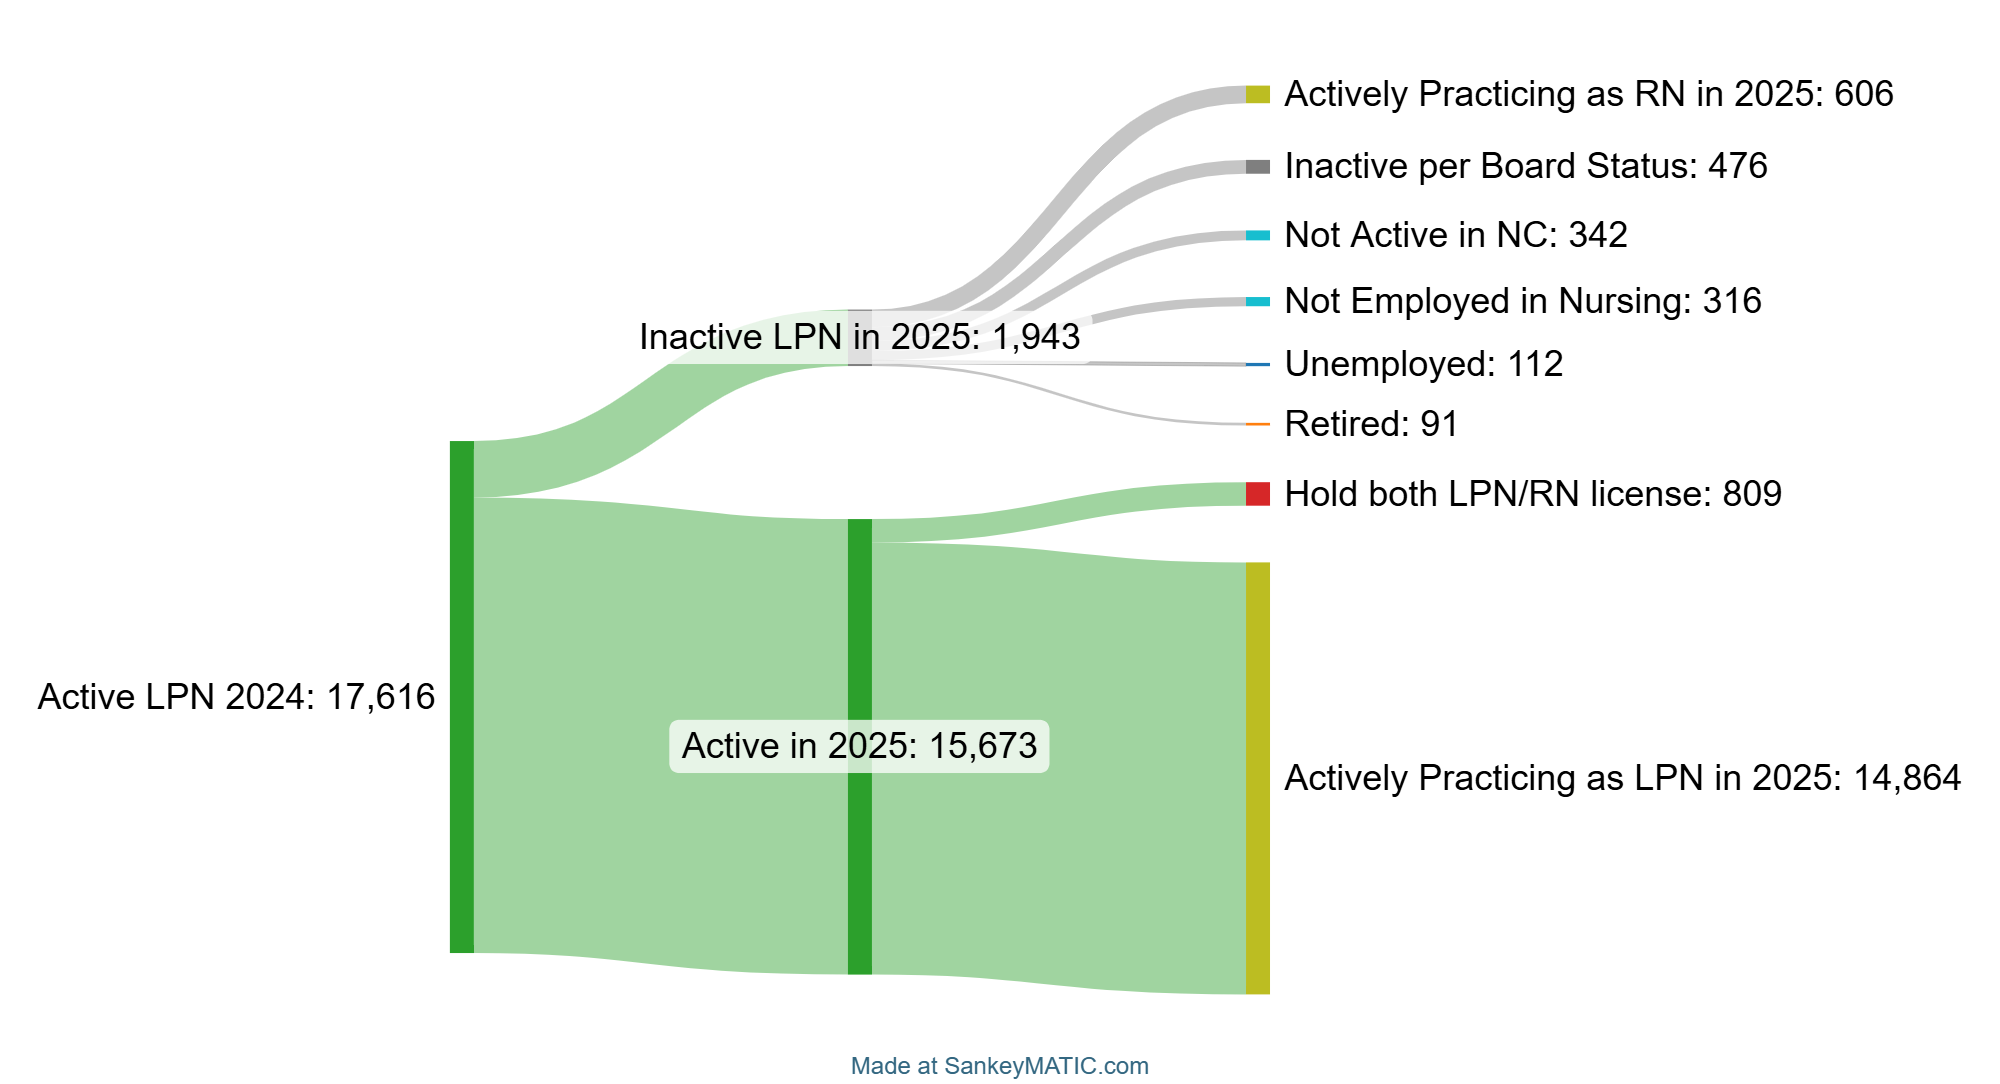
We examined the share of LPNs who were retained versus who exited active practice between 2024 and 2025. The majority (84.4%, n=14,864) of LPNs in the 2024 workforce were in active practice in NC in 2025. A small percentage (4.6%; n=809) of LPNs active in the 2024 workforce were retained and held active licenses as both an LPN and an RN in North Carolina in 2025.1
Figure 5. Status of 2024 Active NC LPNs in 2025 (n=17,616)
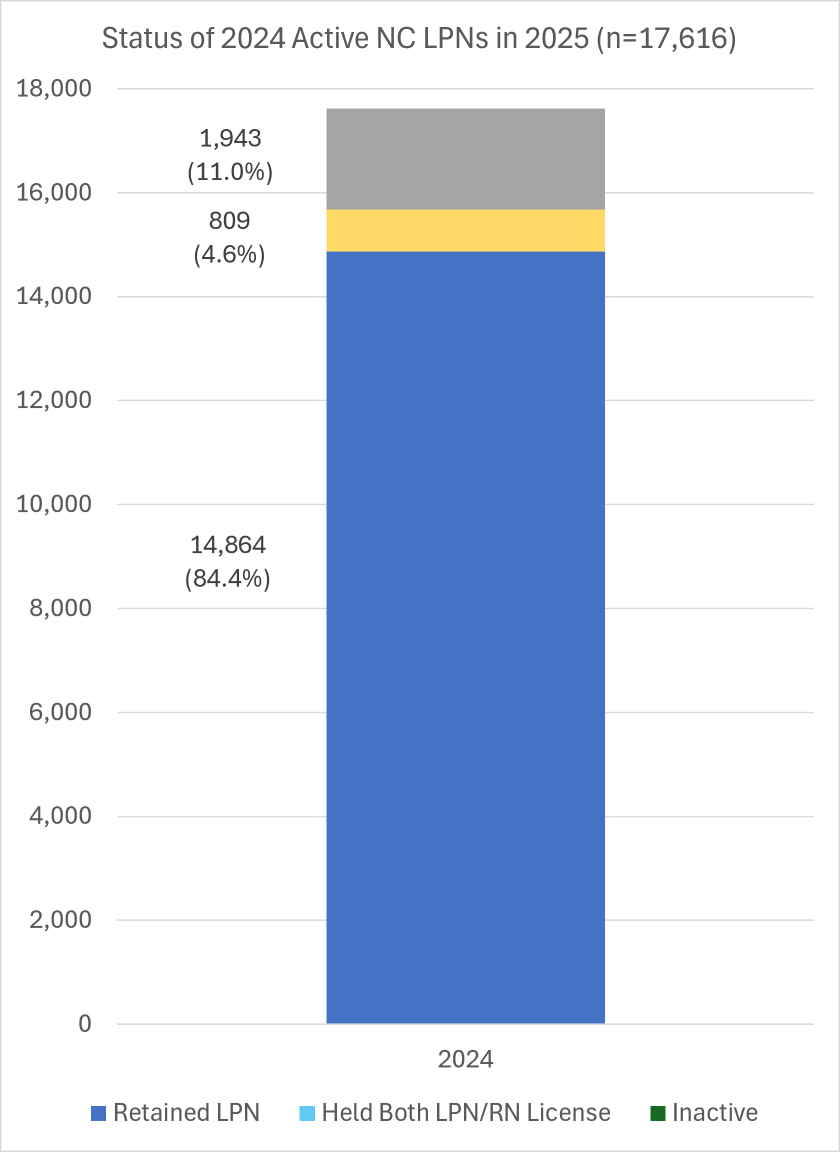
Note: Data include active, licensed LPNs in practice in North Carolina as of October 31 of each year. Source: NC Health Professions Data System with data derived from the NC Board of Nursing. 2 LPNs in active practice in 2024 were not licensed in 2025.
More than 1 in 10 (11.0%, n=1,943) of active practice LPNs in 2024 were not in practice in 2025. Of those LPNs who were inactive, 31.1% (n=606/1943) remained in the NC workforce and were licensed as RNs. Nearly one-quarter of inactive LPNs (24.5%, n=476) had their license placed on inactive status or had relocated to another compact state. Of the remainder, 16% (n=316) left employment in nursing, 5.8% (n=112) reported being unemployed, and 4.7% (n=91) retired.
Figure 6. Detailed Status of 2024 Active NC LPNs in 2025
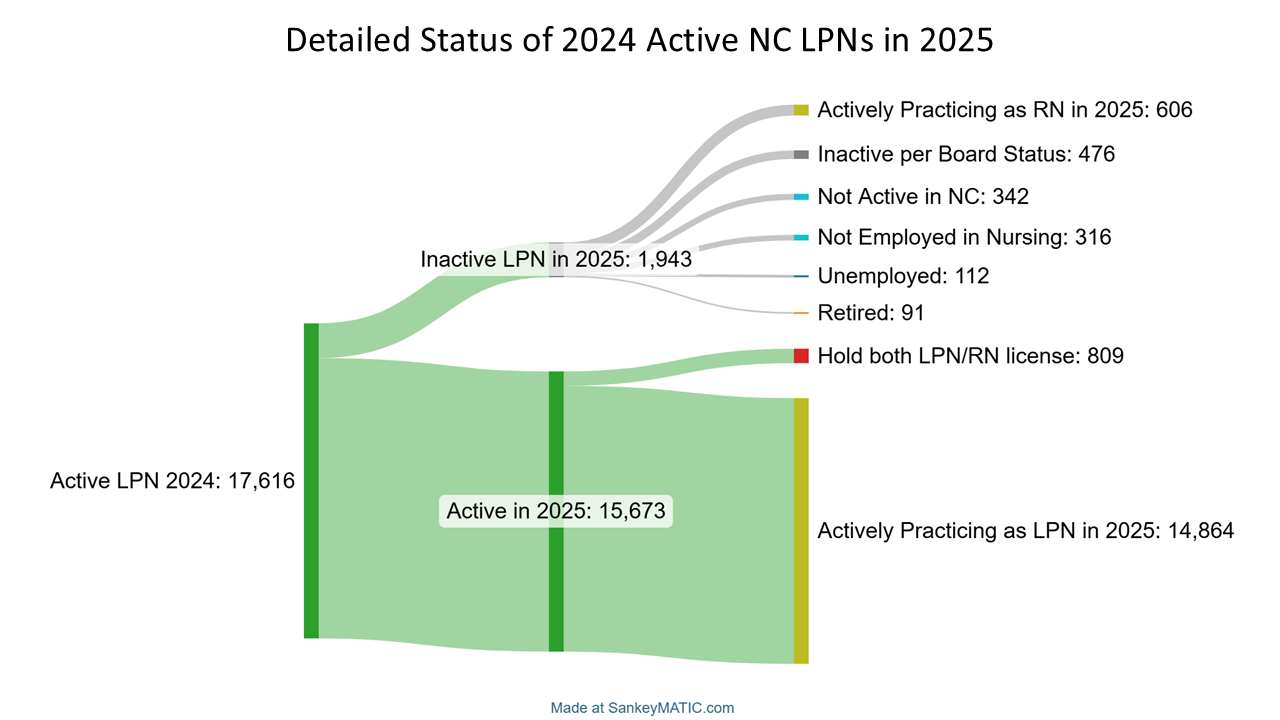
Note: Data include active, licensed LPNs in practice in North Carolina as of October 31 of each year. Data are derived from the North Carolina State Board of Nursing.
Conclusion
Licensed Practical Nurses (LPNs) play a critical role in meeting the health care needs of North Carolinians, particularly those receiving care in nursing homes, extended care facilities, and assisted living settings. While the number of new LPNs entering the workforce from North Carolina educational programs has increased in recent years, overall workforce growth has not kept pace with the state’s population growth. The COVID-19 pandemic had a significant impact on the LPN workforce, with the number of active LPNs declining between 2020 and 2022. Although the workforce has partially recovered, North Carolina would need more than 600 additional LPNs to return to its pre-pandemic staffing level of 2019.
Long-term care settings continue to employ approximately one-third of North Carolina’s LPN workforce, but employment in these settings has steadily declined over the past decade. This trend is particularly concerning given the state’s aging population and growing demand for long-term care services. The decline has been especially pronounced in rural areas, where the number of LPNs working in nursing homes, extended care facilities, and assisted living facilities fell nearly 30% between 2016 and 2025. At the same time, LPNs are increasingly employed in hospitals and ambulatory care settings. These shifts may create challenges not only for long-term care providers seeking to recruit and retain staff, but also for hospitals that depend on a well-functioning long-term care system to facilitate timely patient discharge and transitions of care.
The educational pipeline offers some encouraging signs. Enrollment in North Carolina LPN programs has increased substantially in recent years, and the number of graduates taking the NCLEX-PN examination has also grown. However, the data suggest that many newly licensed LPNs educated in North Carolina are entering hospital practice, while LPNs educated outside the state are more likely to work in long-term care settings. As a result, increasing the number of graduates alone may not be sufficient to address workforce shortages in nursing homes, extended care facilities, and assisted living settings.
Addressing LPN workforce challenges will require a combination of strategies focused on increasing workforce supply and retention. Continued investment in LPN education programs should be paired with efforts to improve recruitment and retention in long-term care settings, where working conditions can be demanding and compensation often lags behind other health care sectors. Career mobility pathways are also an important component of the workforce sustainability. Nearly one-third of LPNs who left active LPN practice between 2024 and 2025 remained in nursing by becoming registered nurses. Strengthening pathways that support Certified Nursing Assistants in becoming LPNs, while also creating incentives for LPNs to practice and remain in long-term care, may help ensure an adequate workforce to meet North Carolina’s future health care needs.
Data and Methods
This descriptive study draws on LPN licensure data from 2016-2025. These data are collected by the North Carolina Board of Nursing (NC BON) and are housed in the North Carolina Health Professions Data System at the Cecil G. Sheps Center for Health Services Research. Unless otherwise stated, data for each year include LPNs in NC with an active license, and do not include LPNs with inactive licenses or LPNs who are working outside NC.
Note: In 2018, the NC Board of Nursing (along with nursing regulation boards across the U.S.) conducted a large-scale update of NURSYS, the National Council of State Boards of Nursing’s electronic data system to track regulation and licensure data. The increase in the number of NC nurses in 2018 is likely an artifact of the transition to the updated NURSYS data system, rather than a true spike in the number of active nurses in NC’s workforce.
Suggested Citation: Fraher EP, Spero JC, Jimenez MP. North Carolina’s LPN Workforce Faces a Double Challenge: Declining Supply and Fewer Nurses in Long-Term Care. Program on Health Workforce Research and Policy. Cecil G. Sheps Center for Health Services Research. The University of North Carolina at Chapel Hill. November 6, 2026.
-
RNs practice with more independence and have a broader scope of practice than LPNs. Nurses are accountable to their highest level of education and licensure standards by the NC Board of Nursing. ↩︎