Physicians Who Complete Both Medical School and Residency in North Carolina Are More Likely to Stay Here to Practice
By Evan Galloway
Aug 24, 2026
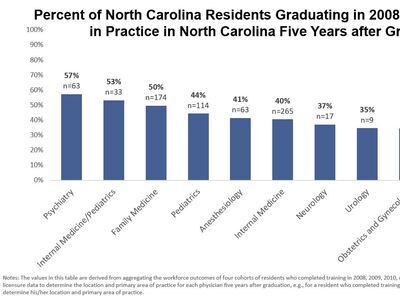
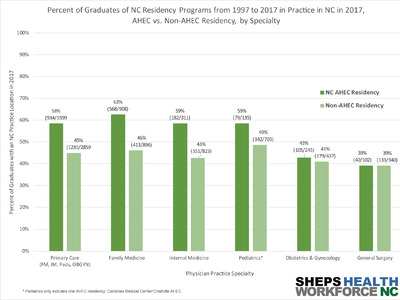
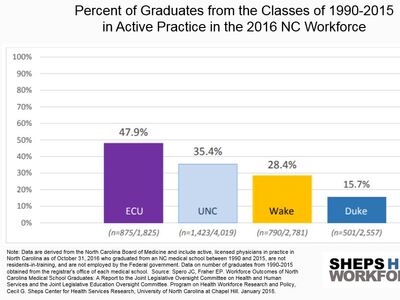
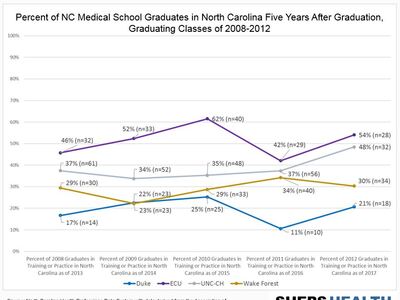
Roughly 30-40% of the physicians who graduate from one of NC’s medical schools are working in the state five years after graduating. Medical school is not the final step in a physician’s education; physicians must complete a residency in a medical specialty before they can practice medicine. Residency location is one of the strongest predictors of where physicians ultimately practice. Physicians who complete residency training in NC are retained in-state at higher rates than those who complete medical school in NC, making residency training investments an important component of building the state’s physician workforce. But what happens when physicians complete both medical school and a residency in North Carolina?
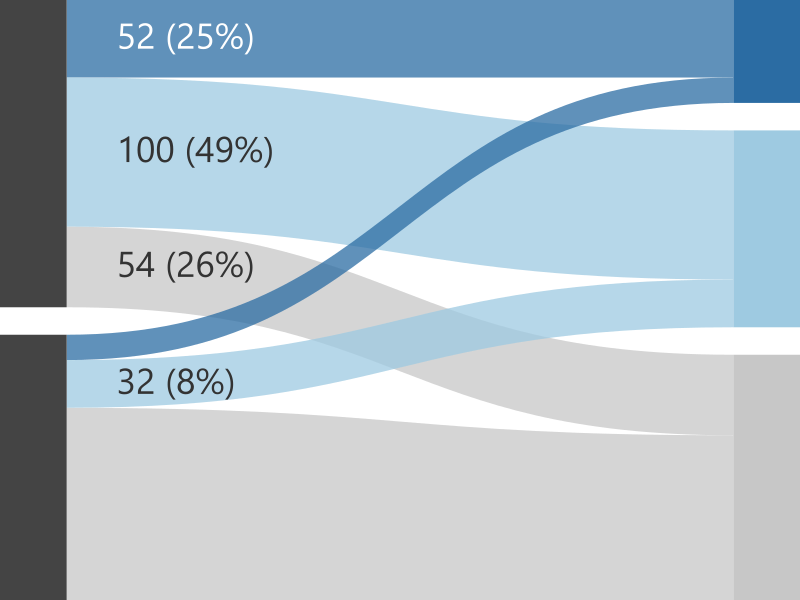
To answer this question, we looked at two cohorts from our annual medical student tracking report, graduates from 2015 and 2020. We identified North Carolina medical school graduates who also completed a residency or fellowship in NC, who we call “double-NC physicians”. Double-NC physicians work in NC at far higher rates than physicians who completed only medical school or only a residency/fellowship in NC (Figure 1 and Table 1). For the 2020 graduating cohort, 74% of the double-NC physicians were practicing or in continued training in NC five years later; similarly, 70% of the double-NC physicians from the class of 2015 were practicing in NC after ten years. Roughly one quarter of the double-NC physicians in both cohorts were practicing primary care in North Carolina in 2025, compared to 10-15% of all NC graduates in recent years.
Figure 1. North Carolina medical school graduates who attended a North Carolina residency or fellowship stayed in NC at higher rates than those who did not, five and ten years after medical school graduation.
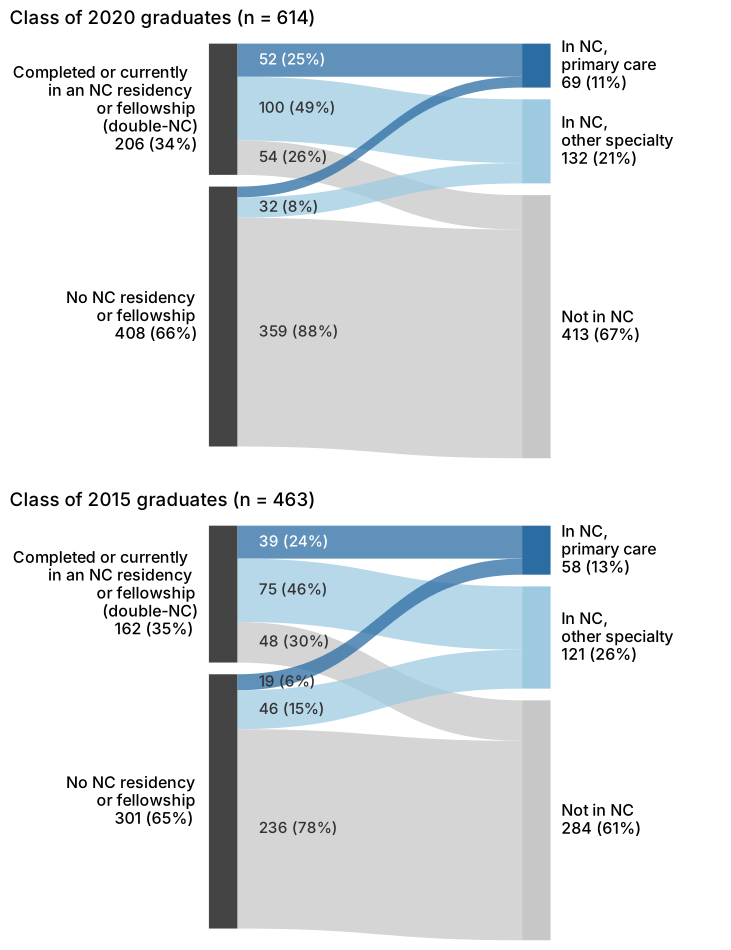
Note. The class of 2020 is observed five years after medical school graduation and the class of 2015 ten years after. Band widths are numbers of graduates, while colors indicate retention in North Carolina and primary care practice status. Band labels give the number and share of each training group. Physicians who trained in NC include those who completed or are currently in an NC residency or fellowship.
View the data shown in Figure 1 as a table
| Cohort | Training group | In NC, primary care | In NC, other specialty | Not in NC | Total |
|---|---|---|---|---|---|
| Class of 2020 | Completed or currently in an NC residency or fellowship (double-NC) | 52 (25%) | 100 (49%) | 54 (26%) | 206 (34%) |
| Class of 2020 | No NC residency or fellowship | 17 (4%) | 32 (8%) | 359 (88%) | 408 (66%) |
| Class of 2020 | All graduates | 69 (11%) | 132 (21%) | 413 (67%) | 614 |
| Class of 2015 | Completed or currently in an NC residency or fellowship (double-NC) | 39 (24%) | 75 (46%) | 48 (30%) | 162 (35%) |
| Class of 2015 | No NC residency or fellowship | 19 (6%) | 46 (15%) | 236 (78%) | 301 (65%) |
| Class of 2015 | All graduates | 58 (13%) | 121 (26%) | 284 (61%) | 463 |
Note. Cell values are number of graduates. Percentages in the group rows are shares of that training group. Percentages in the "All graduates" rows and Total column are shares of the graduating cohort.
Tables 2 and 3 show outcomes for primary care residency specialties. Double-NC physicians who completed a residency in Family Medicine had in-state retention rates of about 90% across both cohorts. Double-NC physicians who completed a residency in Internal Medicine, Ob/Gyn, and Pediatrics all had retention rates of roughly 60-75%.
Interestingly, about 1 in 7 double-NC physicians initially left NC for an intern year or a residency but they came back for an advanced residency or fellowship and subsequently stayed in NC at a similar rate as the rest of the double-NC group.
Table 1. Retention of North Carolina Medical School Graduates Who Completed or Are Currently in a Residency or Fellowship in North Carolina by Medical School Graduation Year, 2025.
| Outcome | Class of 2020 | Class of 2015 |
|---|---|---|
| Completed/Currently in NC residency/fellowship | 206 | 162 |
| In NC (practice or training) | 152 (74%) | 114 (70%) |
| In primary care | 52 (25%) | 39 (24%) |
| In primary care in a most-distressed tract (ADI 9–10) | 19 (9%) | 6 (4%) |
| In a rural area | 9 (4%) | 7 (4%) |
| In rural primary care | 6 (3%) | 5 (3%) |
| At a safety-net facility | 3 (1%) | 5 (3%) |
Note. Percentages are shares of the cohort’s NC medical school graduates who also trained in an NC residency or fellowship (the double-NC physicians). Indented rows are subsets of double-NC physicians in NC. For inclusion in this table, double-NC physicians must have completed or be in progress in an NC residency or fellowship.
Table 2. Retention of 2020 North Carolina Medical School Graduates Who Completed a Residency in North Carolina by Residency Specialty, Primary Care Specialties, 2025.
| NC residency specialty | Physicians (n) | In NC, n (%) | In NC primary care, n (%) | In rural NC, n (%) |
|---|---|---|---|---|
| Family Medicine | 26 | 23 (88%) | 23 (88%) | 5 (19%) |
| Internal Medicine | 39 | 26 (67%) | 9 (23%) | 1 (3%) |
| Pediatrics | 21 | 15 (71%) | 8 (38%) | 1 (5%) |
| IM-Peds | 5 | 5 (100%) | 4 (80%) | 0 (0%) |
| Ob/Gyn | 8 | 5 (62%) | 4 (50%) | 0 (0%) |
| All primary care | 99 | 74 (75%) | 48 (48%) | 7 (7%) |
Table 3. Retention of 2015 North Carolina Medical School Graduates Who Completed a Residency in North Carolina by Residency Specialty, Primary Care Specialties, 2025.
| NC residency specialty | Physicians (n) | In NC, n (%) | In NC primary care, n (%) | In rural NC, n (%) |
|---|---|---|---|---|
| Family Medicine | 21 | 19 (90%) | 19 (90%) | 2 (10%) |
| Internal Medicine | 27 | 20 (74%) | 4 (15%) | 0 (0%) |
| Pediatrics | 19 | 12 (63%) | 8 (42%) | 1 (5%) |
| IM-Peds | 4 | 2 (50%) | 1 (25%) | 0 (0%) |
| Ob/Gyn | 7 | 5 (71%) | 5 (71%) | 1 (14%) |
| All primary care | 78 | 58 (74%) | 37 (47%) | 4 (5%) |
Note. Percentages are shares of the physicians in each row. Specialty is the NC residency, not current practice. Double-NC physicians who only completed a fellowship in NC are included in Table 1 but not in Tables 2 and 3.